Include Legend
includeLegend.RdInclude legend in regression plot (function plot()) or in bias plot (function plotBias ()) with two or more lines.
includeLegend(
  models = list(),
  digits = 2,
  design = paste(1:2),
  place = c("topleft", "topright", "bottomleft", "bottomright"),
  colors,
  lty = rep(1, length(models)),
  lwd = rep(2, length(models)),
  box.lty = "blank",
  cex = 0.8,
  bg = "white",
  inset = c(0.01, 0.01),
  bias = FALSE,
  model.names = NULL,
  ...
)
Arguments
- models
list of length n with Objects of class "MCResult".
- digits
number of digits in Coefficients.
- design
type of legend design. There are two possible designs: "1" and "2" (See example).
- place
place for Legend: "topleft","topright","bottomleft" or "bottomright".
- colors
vector of length n with color of regression lines.
- lty
vector of length n with type of regression lines.
- lwd
vector of length n with thickness of regression lines.
- box.lty
box line-type
- cex
numeric value representing the plotting symbol magnification factor
- bg
the background-color of the legend box
- inset
inset distance(s) from the margins as a fraction of the plot region when legend is placed by keyword.
- bias
logical value. If bias = TRUE, it will be drawn a legend for
plotBias()function.- model.names
legend names for different models. If NULL the regression type will be used.
- ...
other parameters of function legend().
Value
Legend in plot.
See also
Examples
#library("mcr")
data(creatinine,package="mcr")
x <- creatinine$serum.crea
y <- creatinine$plasma.crea
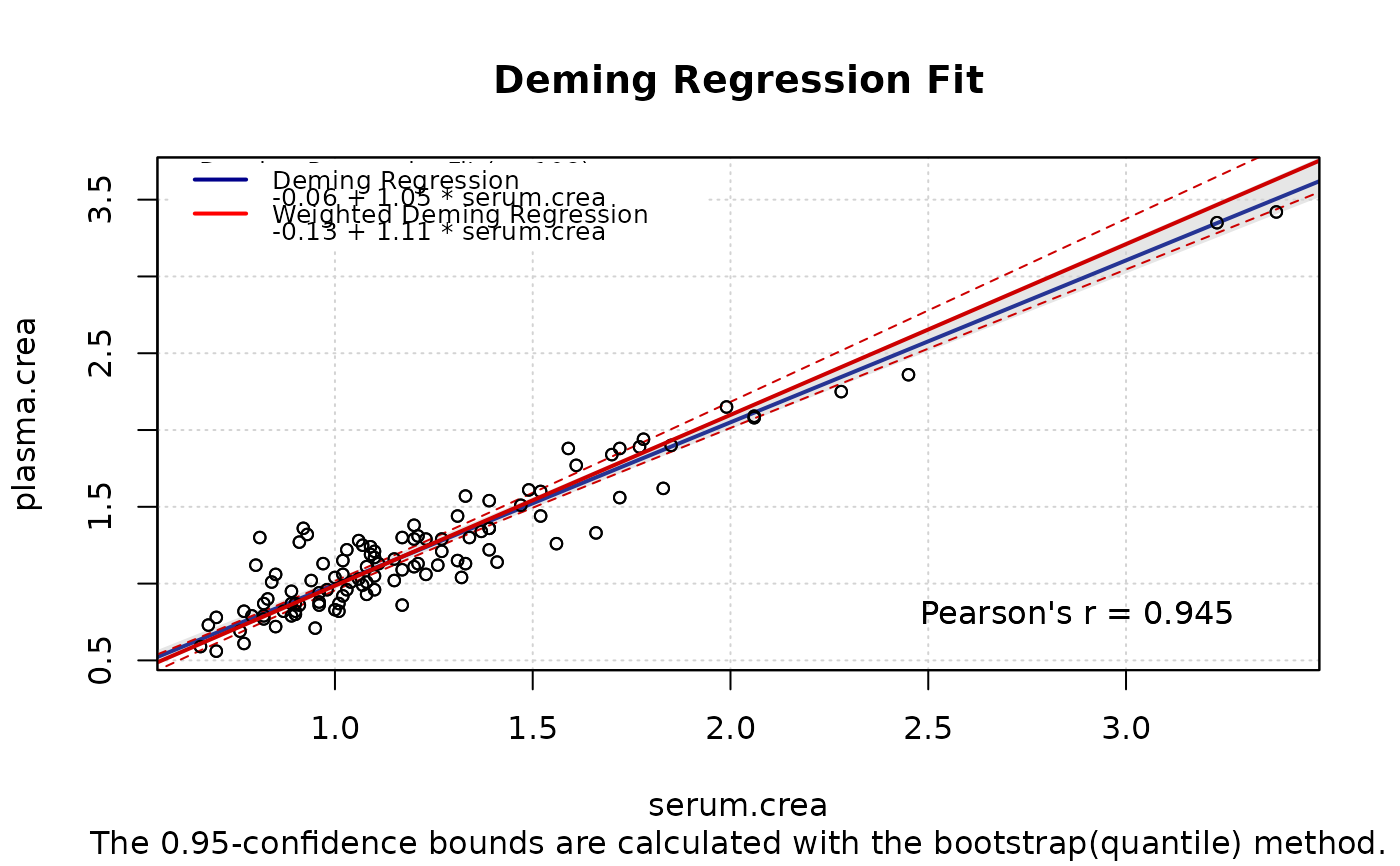
m1 <- mcreg(x,y,method.reg="Deming", mref.name="serum.crea",
mtest.name="plasma.crea", na.rm=TRUE)
#> Please note:
#> 2 of 110 observations contain missing values and have been removed.
#> Number of data points in analysis is 108.
m2 <- mcreg(x,y,method.reg="WDeming", method.ci="jackknife",
mref.name="serum.crea",
mtest.name="plasma.crea", na.rm=TRUE)
#> Please note:
#> 2 of 110 observations contain missing values and have been removed.
#> Number of data points in analysis is 108.
#> Jackknife based calculation of standard error and confidence intervals according to Linnet's method.
plot(m1, XLIM=c(0.5,3),YLIM=c(0.5,3), Legend=FALSE,
Title="Deming vs. weighted Deming regression",
Points.pch=19,ci.area=TRUE, ci.area.col=grey(0.9),
identity=FALSE, Grid=FALSE, Sub="")
#> Warning: "XLIM" is not a graphical parameter
#> Warning: "YLIM" is not a graphical parameter
#> Warning: "Legend" is not a graphical parameter
#> Warning: "Title" is not a graphical parameter
#> Warning: "Points.pch" is not a graphical parameter
#> Warning: "Grid" is not a graphical parameter
#> Warning: "Sub" is not a graphical parameter
plot(m2, ci.area=FALSE, ci.border=TRUE, ci.border.col="red3",
reg.col="red3", Legend=FALSE,add=TRUE,
Points=FALSE, identity=FALSE, Grid=FALSE)
#> Warning: "Legend" is not a graphical parameter
#> Warning: "Points" is not a graphical parameter
#> Warning: "Grid" is not a graphical parameter
includeLegend(place="topleft",models=list(m1,m2),
colors=c("darkblue","red"), design="1", digits=2)