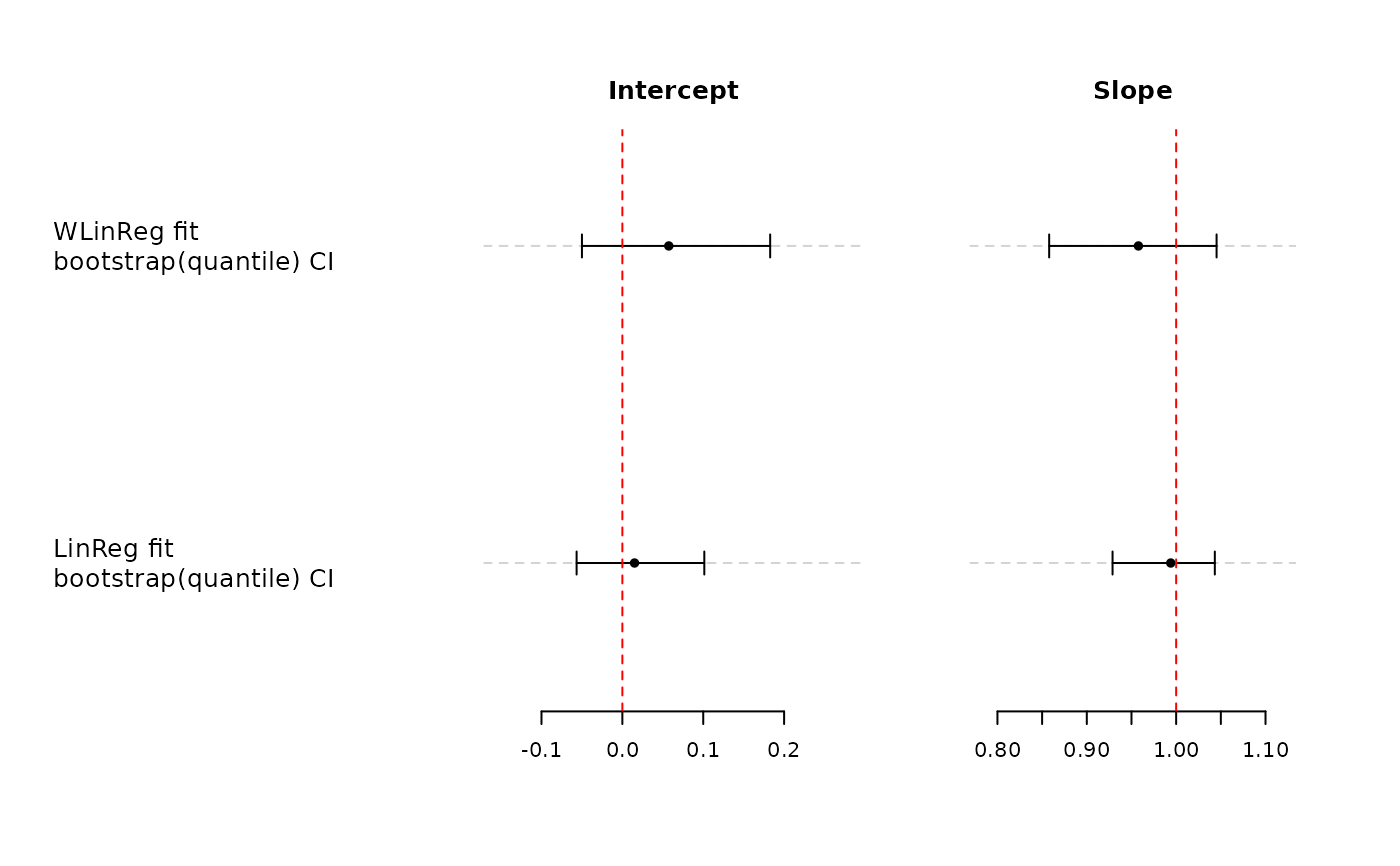
Graphical Comparison of Regression Parameters and Associated Confidence Intervals
compareFit.RdGraphical comparison of regression parameters (intercept and slope) and their associated 100(1-alpha)% confidence intervals for multiple fitted models of 'MCResult' sub-classes.
compareFit(...)Value
No return value, instead a plot is generated
Examples
     library("mcr")
     data("creatinine", package="mcr")
     fit.lr <- mcreg(as.matrix(creatinine), method.reg="LinReg", na.rm=TRUE)
#> Please note:
#> 2 of 110 observations contain missing values and have been removed.
#> Number of data points in analysis is 108.
     fit.wlr <- mcreg(as.matrix(creatinine), method.reg="WLinReg", na.rm=TRUE)
#> Please note:
#> 2 of 110 observations contain missing values and have been removed.
#> Number of data points in analysis is 108.
     compareFit( fit.lr, fit.wlr )