Plot Residuals of an MCResult Object
MCResult.plotResiduals.RdPlot Residuals of an MCResult Object
Arguments
- .Object
object of type "MCResult".
- res.type
If res.type="y" the difference between the test method and it's prediction will be drawn. If res.type="x" the reference method and it's prediction will be drawn. In case ordinary and weighted ordinary linear regression this difference will be zero.
- xaxis
Values on the x-axis. One can choose from estimated values of x (xaxis=
"xhat"), y (xaxis="xhat") or the mean of estimated values of x and y (xaxis="both"). If res.type="optimized" the proper type of residuals for each regression will be drawn.- ref.line
logical value. If
ref.line = TRUE(default), the reference line will be drawn.- ref.line.col
reference line color.
- ref.line.lty
reference line type.
- ref.line.lwd
reference line width.
- main
character string specifying the main title of the plot
- xlab
label for the x-axis
- ylab
label for the y-axis
- add.grid
logical value. If
add.grid = TRUE(default) the gridlines will be drawn.- ...
further graphical parameters
Value
No return value, instead a plot is generated
See also
Examples
data(creatinine,package="mcr")
x <- creatinine$serum.crea
y <- creatinine$plasma.crea
# Deming regression fit.
# The confidence intercals for regression coefficients
# are calculated with analytical method
model <- mcreg( x,y,error.ratio=1,method.reg="WDeming", method.ci="jackknife",
mref.name = "serum.crea", mtest.name = "plasma.crea", na.rm=TRUE )
#> Please note:
#> 2 of 110 observations contain missing values and have been removed.
#> Number of data points in analysis is 108.
#> Jackknife based calculation of standard error and confidence intervals according to Linnet's method.
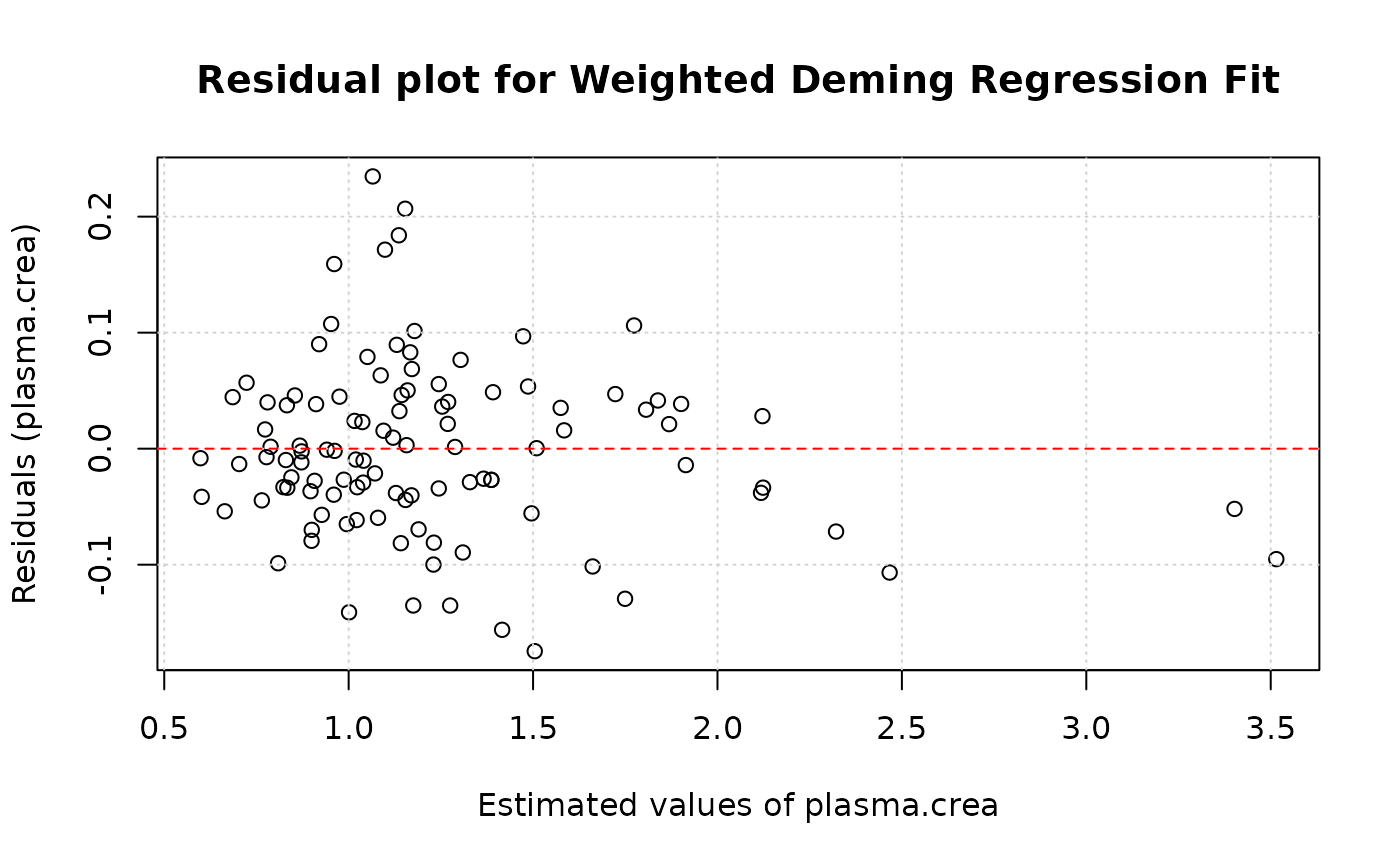
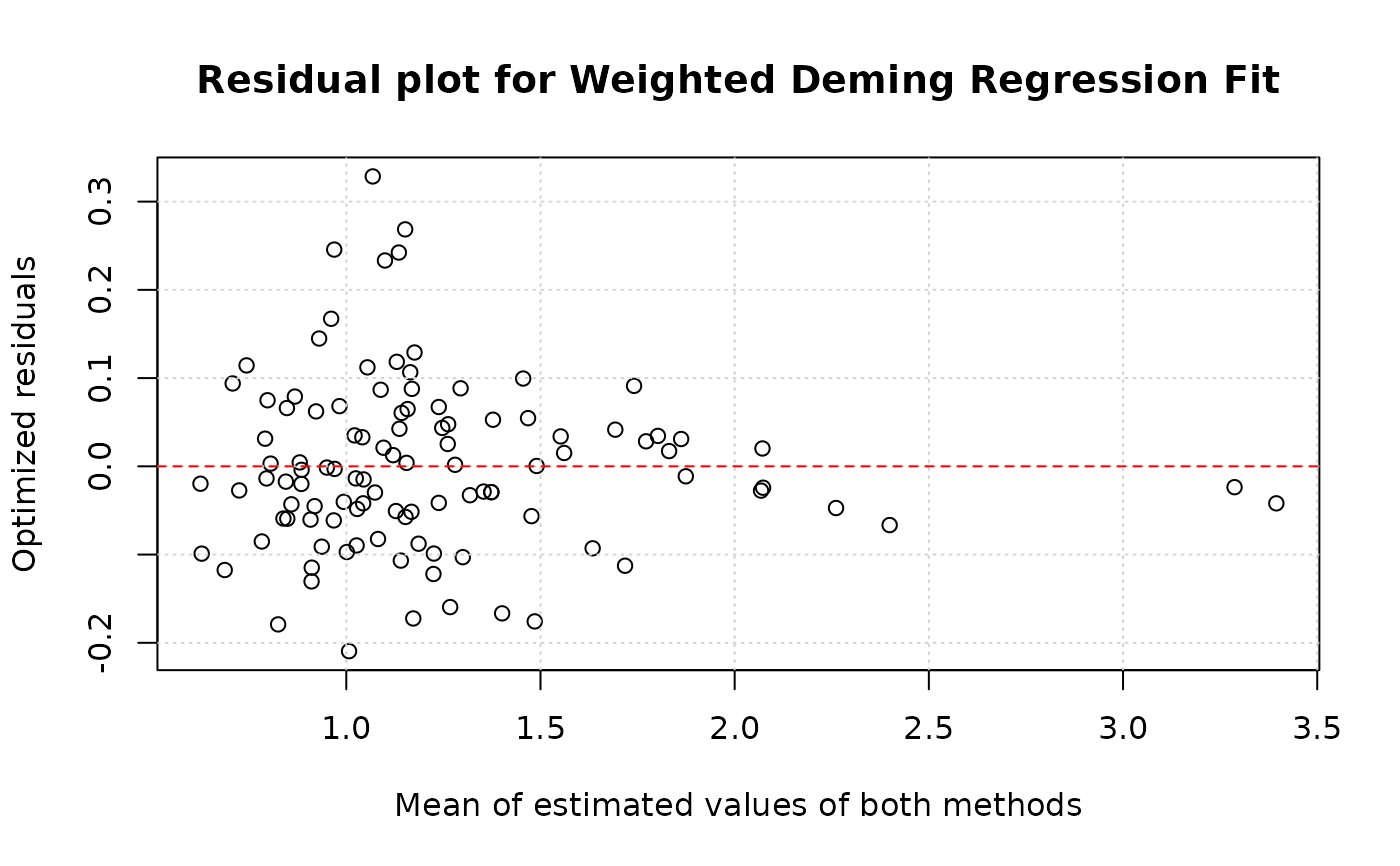
plotResiduals(model, res.type="optimized", xaxis="both" )
 plotResiduals(model, res.type="y", xaxis="yhat")