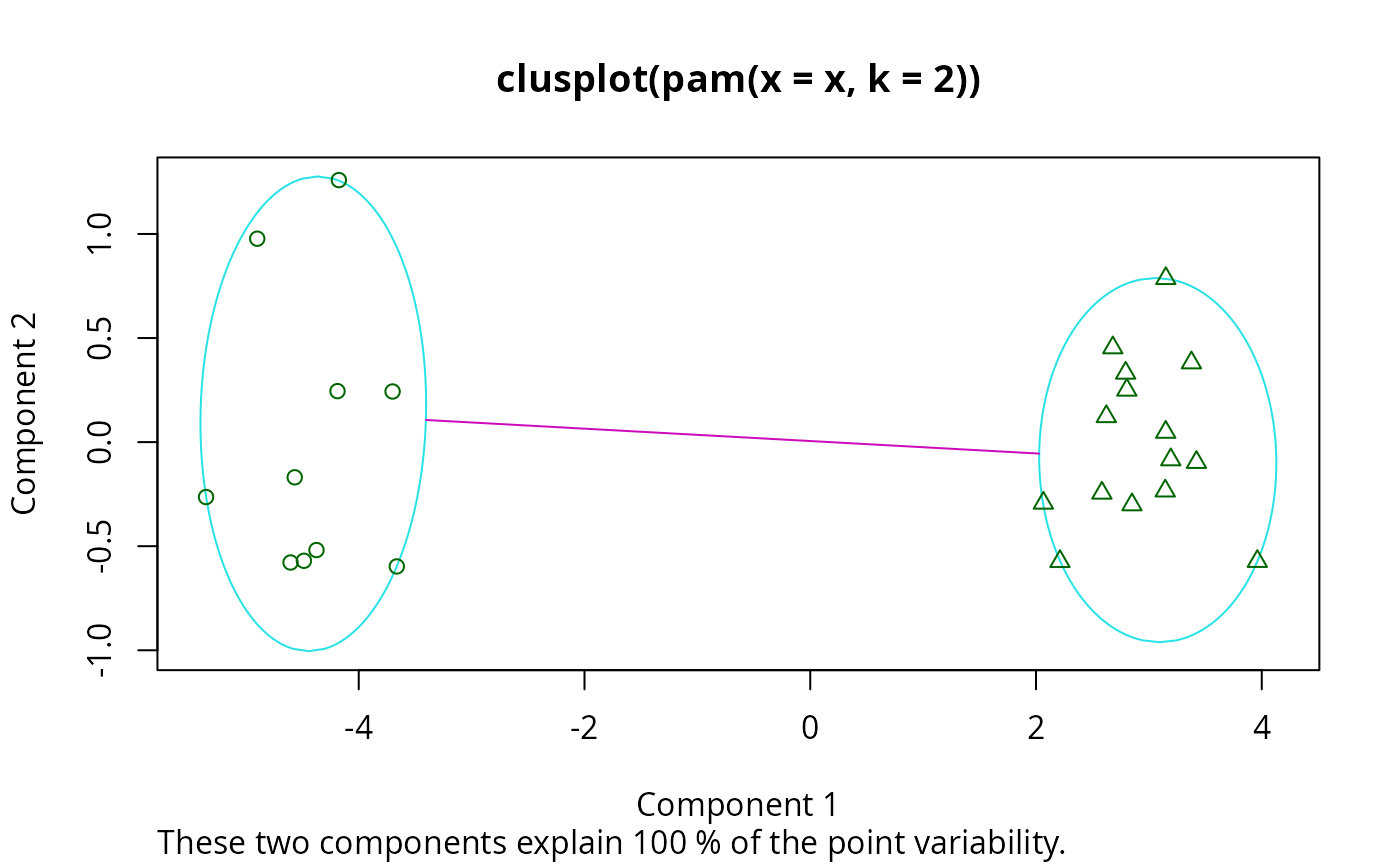
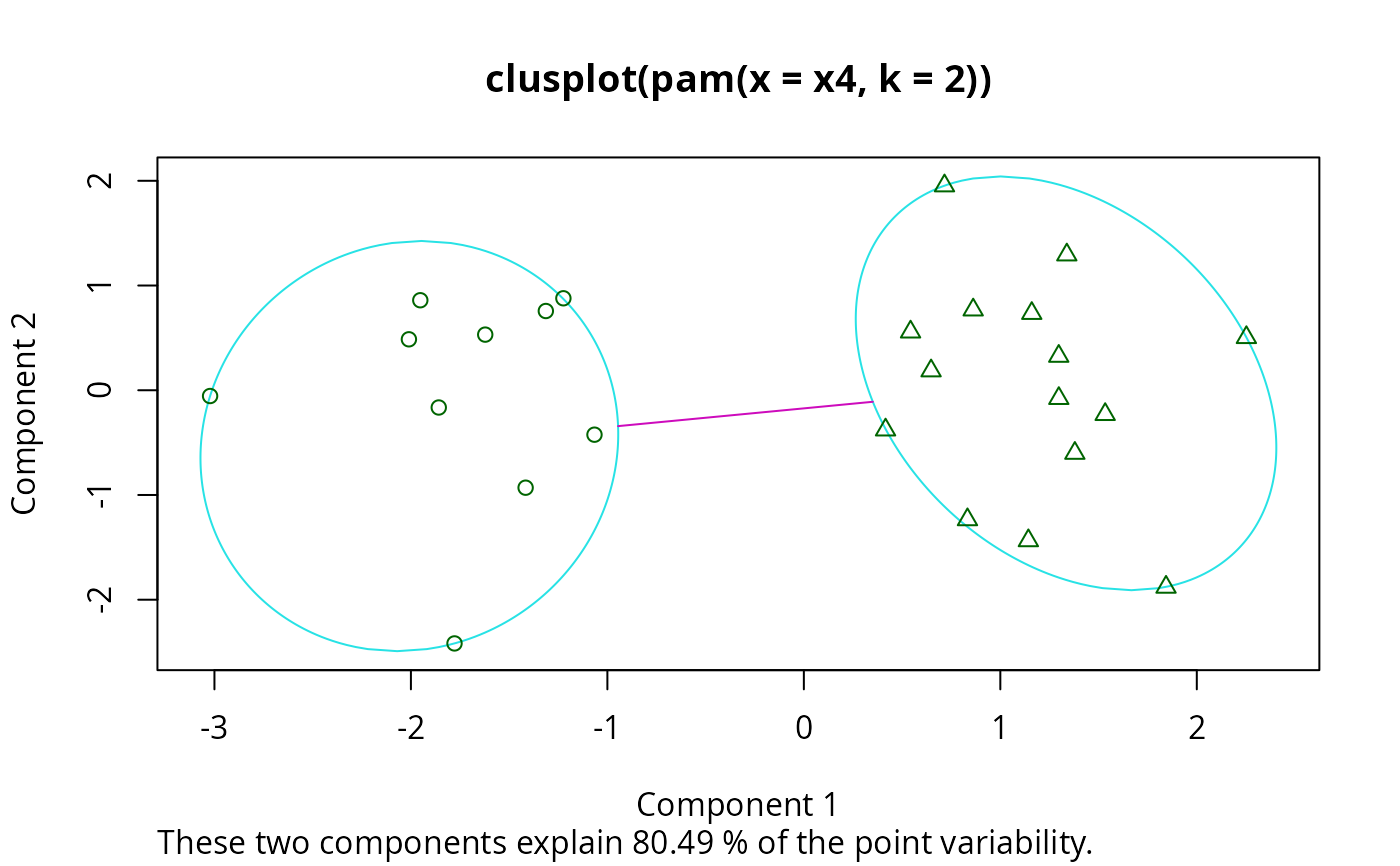
Bivariate Cluster Plot (of a Partitioning Object)
clusplot.partition.RdDraws a 2-dimensional “clusplot” (clustering plot) on the
current graphics device.
The generic function has a default and a partition method.
Arguments
- x
an R object, here, specifically an object of class
"partition", e.g. created by one of the functionspam,clara, orfanny.- main
title for the plot; when
NULL(by default), a title is constructed, usingx$call.- dist
when
xdoes not have adissnor adatacomponent, e.g., forpam(dist(*), keep.diss=FALSE),distmust specify the dissimilarity for the clusplot.- ...
optional arguments passed to methods, notably the
clusplot.defaultmethod (except for thedissone) may also be supplied to this function. Many graphical parameters (seepar) may also be supplied as arguments here.
Value
For the partition (and default) method: An invisible
list with components Distances and Shading, as for
clusplot.default, see there.
Details
The clusplot.partition() method relies on clusplot.default.
If the clustering algorithms pam, fanny and clara
are applied to a data matrix of observations-by-variables then a
clusplot of the resulting clustering can always be drawn. When the
data matrix contains missing values and the clustering is performed
with pam or fanny, the dissimilarity
matrix will be given as input to clusplot. When the clustering
algorithm clara was applied to a data matrix with NAs
then clusplot() will replace the missing values as described in
clusplot.default, because a dissimilarity matrix is not
available.
See also
clusplot.default for references;
partition.object, pam,
pam.object, clara,
clara.object, fanny,
fanny.object, par.