Partitioning Around Medoids (PAM) Object
pam.object.RdThe objects of class "pam" represent a partitioning of a
dataset into clusters.
GENERATION
These objects are returned from pam.
INHERITANCE
The class "pam" inherits from "partition".
Therefore, the generic functions plot and clusplot can
be used on a pam object.
Value
A legitimate pam object is a list with the following components:
- medoids
the medoids or representative objects of the clusters. If a dissimilarity matrix was given as input to
pam, then a vector of numbers or labels of observations is given, elsemedoidsis amatrixwith in each row the coordinates of one medoid.- id.med
integer vector of indices giving the medoid observation numbers.
- clustering
the clustering vector, see
partition.object.- objective
the objective function after the first and second step of the
pamalgorithm.- isolation
vector with length equal to the number of clusters, specifying which clusters are isolated clusters (L- or L*-clusters) and which clusters are not isolated.
A cluster is an L*-cluster iff its diameter is smaller than its separation. A cluster is an L-cluster iff for each observation i the maximal dissimilarity between i and any other observation of the cluster is smaller than the minimal dissimilarity between i and any observation of another cluster. Clearly each L*-cluster is also an L-cluster.- clusinfo
matrix, each row gives numerical information for one cluster. These are the cardinality of the cluster (number of observations), the maximal and average dissimilarity between the observations in the cluster and the cluster's medoid, the diameter of the cluster (maximal dissimilarity between two observations of the cluster), and the separation of the cluster (minimal dissimilarity between an observation of the cluster and an observation of another cluster).
- silinfo
list with silhouette width information, see
partition.object.- diss
dissimilarity (maybe NULL), see
partition.object.- call
generating call, see
partition.object.- data
(possibibly standardized) see
partition.object.
Examples
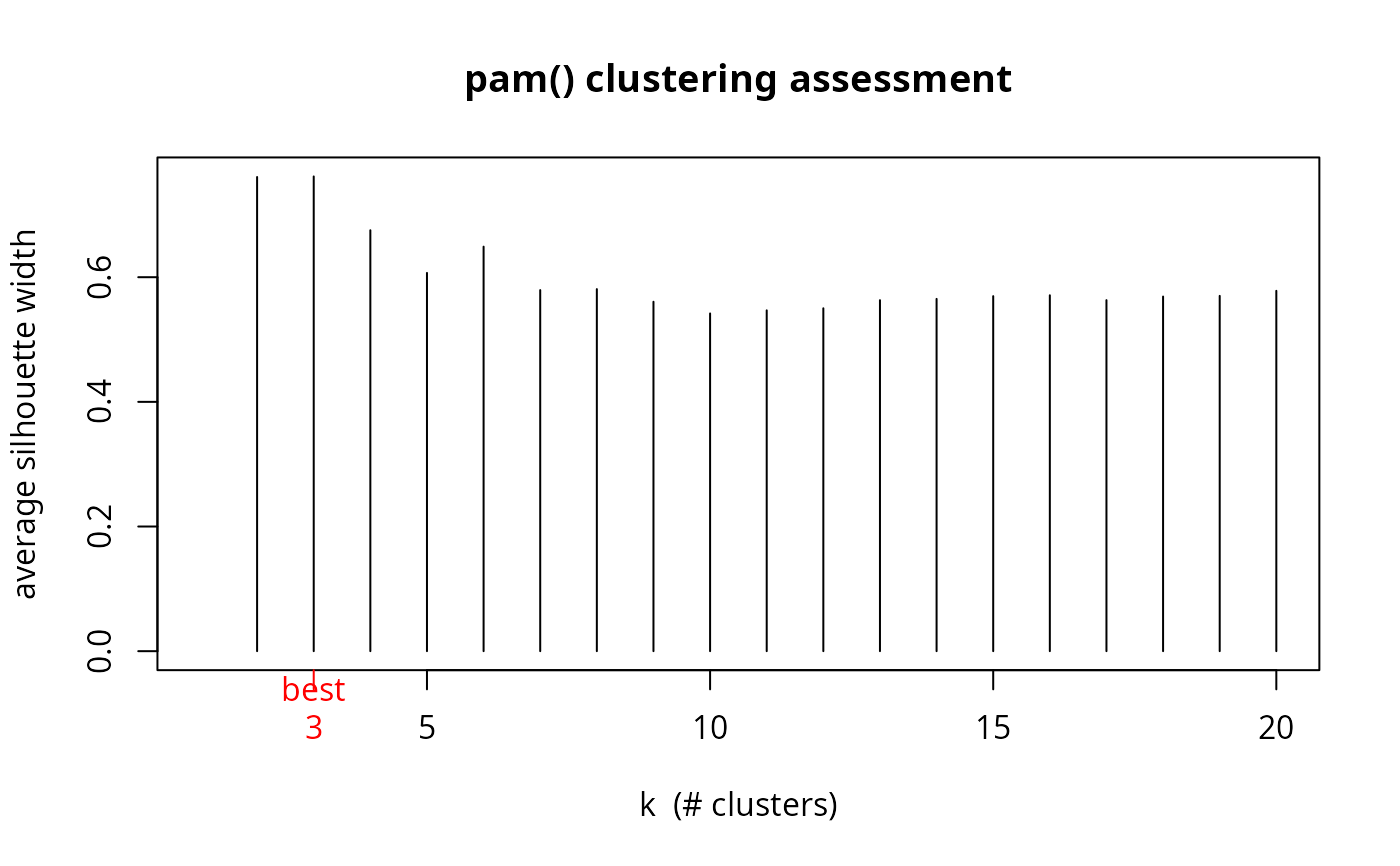
## Use the silhouette widths for assessing the best number of clusters,
## following a one-dimensional example from Christian Hennig :
##
x <- c(rnorm(50), rnorm(50,mean=5), rnorm(30,mean=15))
asw <- numeric(20)
## Note that "k=1" won't work!
for (k in 2:20)
  asw[k] <- pam(x, k) $ silinfo $ avg.width
k.best <- which.max(asw)
cat("silhouette-optimal number of clusters:", k.best, "\n")
#> silhouette-optimal number of clusters: 3

plot(1:20, asw, type= "h", main = "pam() clustering assessment",
     xlab= "k  (# clusters)", ylab = "average silhouette width")
axis(1, k.best, paste("best",k.best,sep="\n"), col = "red", col.axis = "red")