Functions to Identify and Mark Extreme Points in a 2D Plot.
showLabels.RdThis function is called by several graphical functions in the car package to mark extreme points in a 2D plot. Although the user is unlikely to call this function directly, the documentation below applies to all these other functions.
Usage
showLabels(x, y, labels=NULL, method="identify",
  n = length(x), cex=1, col=carPalette()[1], location=c("lr", "ab", "avoid"), ...)
Arguments
- x
Plotted horizontal coordinates.
- y
Plotted vertical coordinates.
- labels
Plotting labels. When called from within a car plotting function, the labels are automatically obtained from the row names in the data frame used to create the modeling object. If
labels=NULL, case numbers will be used. If labels are long, thesubstrorabbreviatefunctions can be used to shorten them. Users may supply their own labels as a character vector of length equal to the number of plotted points. For use with car plotting functions, the number of plotted points is equal to the number of rows of data that have neither missing values nor are excluded using the `subset' argument. When called directly, the length of labels shoud equal the length of x.- method
How points are to be identified. See Details below.
- n
Number of points to be identified. If set to 0, no points are identified.
- cex
Controls the size of the plotted labels. The default is
1.- col
Controls the color of the plotted labels. The default is the first element returned by
carPalette().- location
Where should the label be drawn? The default is
"lr"to draw the label to the left of the point for points in the right-half of the graph and to the right for points in the left-half. The other option is"ab"for above the point for points below the middle of the graph and above the point below the middle. Finally,"avoid"tries to avoid over-plotting labels.- ...
not used.
Details
The argument method determine how the points
to be identified are selected. For the default value of method="identify",
the identify function is used to identify points
interactively using the mouse. Up to n points can be identified,
so if n=0, which is the default in many functions in the car
package, then no point identification is done.
Automatic point identification can be done depending on the value of the
argument method.
method = "x"select points according to their value ofabs(x - mean(x))method = "y"select points according to their value ofabs(y - mean(y))method = "r"select points according to their value ofabs(y), as may be appropriate in residual plots, or others with a meaningful origin at 0method = "mahal"Treat(x, y)as if it were a bivariate sample, and select cases according to their Mahalanobis distance from(mean(x), mean(y))methodcan be a vector of the same length asxconsisting of values to determine the points to be labeled. For example, for a linear modelm, settingmethod=cooks.distance(m)will label the points corresponding to the largest values of Cook's distance, ormethod = which(abs(residuals(m, type="pearson")) > 2would label all observations with Pearson residuals greater than 2 in absolute value. Warning: If missing data are present, points may be incorrectly labelled.methodcan be a vector of case numbers or case-labels, in which case those cases will be labeled. Warning: If missing data are present, a list of case numbers may identify the wrong points. A list of case labels, however, will work correctly with missing values.method = "none"causes no point labels to be shown.
With showLabels, the method argument can be a list, so, for
example method=list("x", "y") would label according to the horizontal
and vertical axes variables.
Finally, if the axes in the graph are logged, the function uses logged-variables where appropriate.
Value
A function primarily used for its side-effect of drawing point labels on a plot. Returns invisibly the labels of the selected points, or NULL if no points are selected. Although intended for use with other functions in the car package, this function can be used directly.
References
Fox, J. and Weisberg, S. (2019) An R Companion to Applied Regression, Third Edition, Sage.
Author
John Fox jfox@mcmaster.ca, Sanford Weisberg sandy@umn.edu
Examples
plot(income ~ education, Prestige)
with(Prestige, showLabels(education, income,
labels = rownames(Prestige), method=list("x", "y"), n=3))
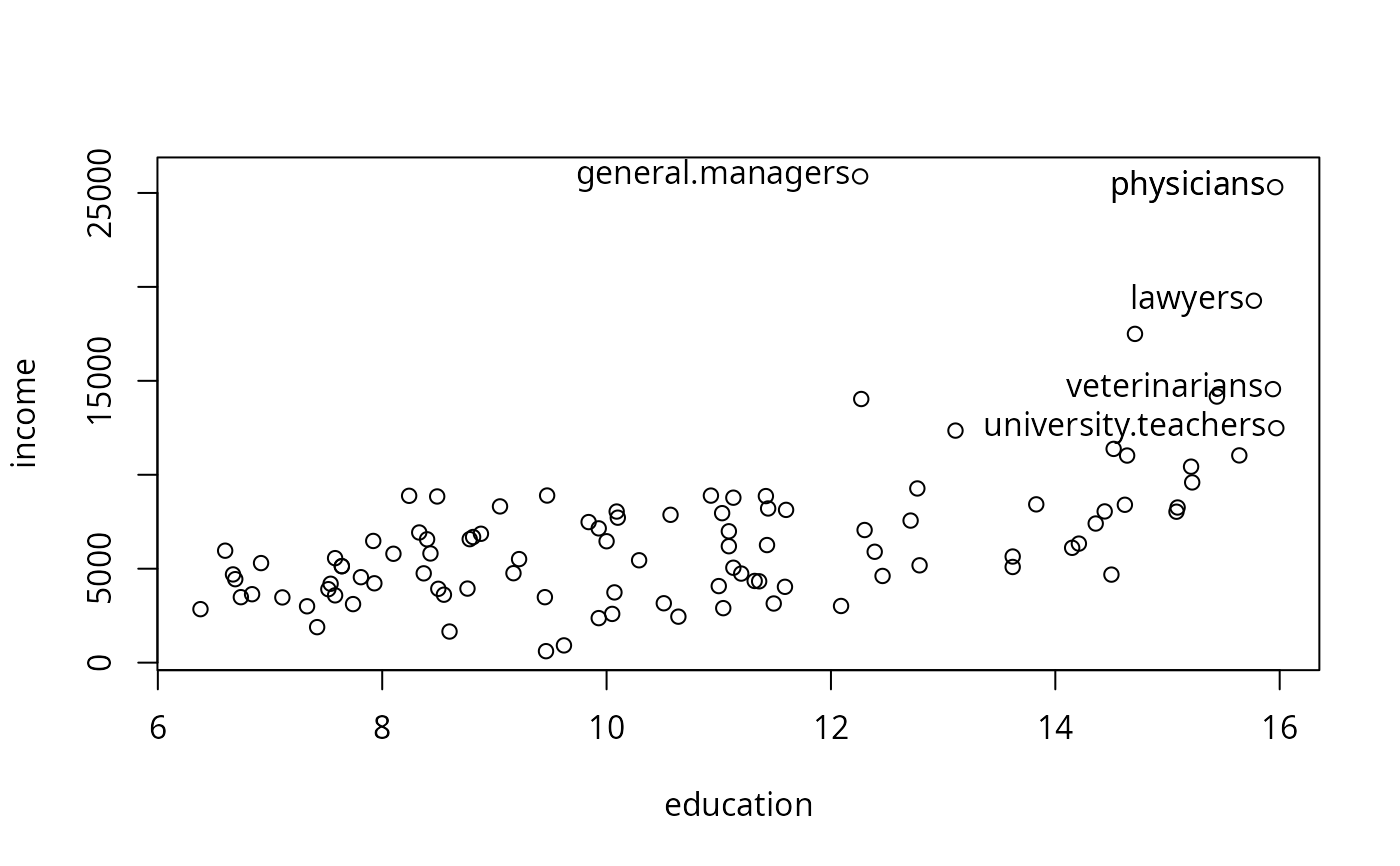 #> university.teachers physicians veterinarians general.managers
#> 21 24 25 2
#> physicians lawyers
#> 24 17
m <- lm(income ~ education, Prestige)
plot(income ~ education, Prestige)
abline(m)
with(Prestige, showLabels(education, income,
labels=rownames(Prestige), method=abs(residuals(m)), n=4))
#> university.teachers physicians veterinarians general.managers
#> 21 24 25 2
#> physicians lawyers
#> 24 17
m <- lm(income ~ education, Prestige)
plot(income ~ education, Prestige)
abline(m)
with(Prestige, showLabels(education, income,
labels=rownames(Prestige), method=abs(residuals(m)), n=4))
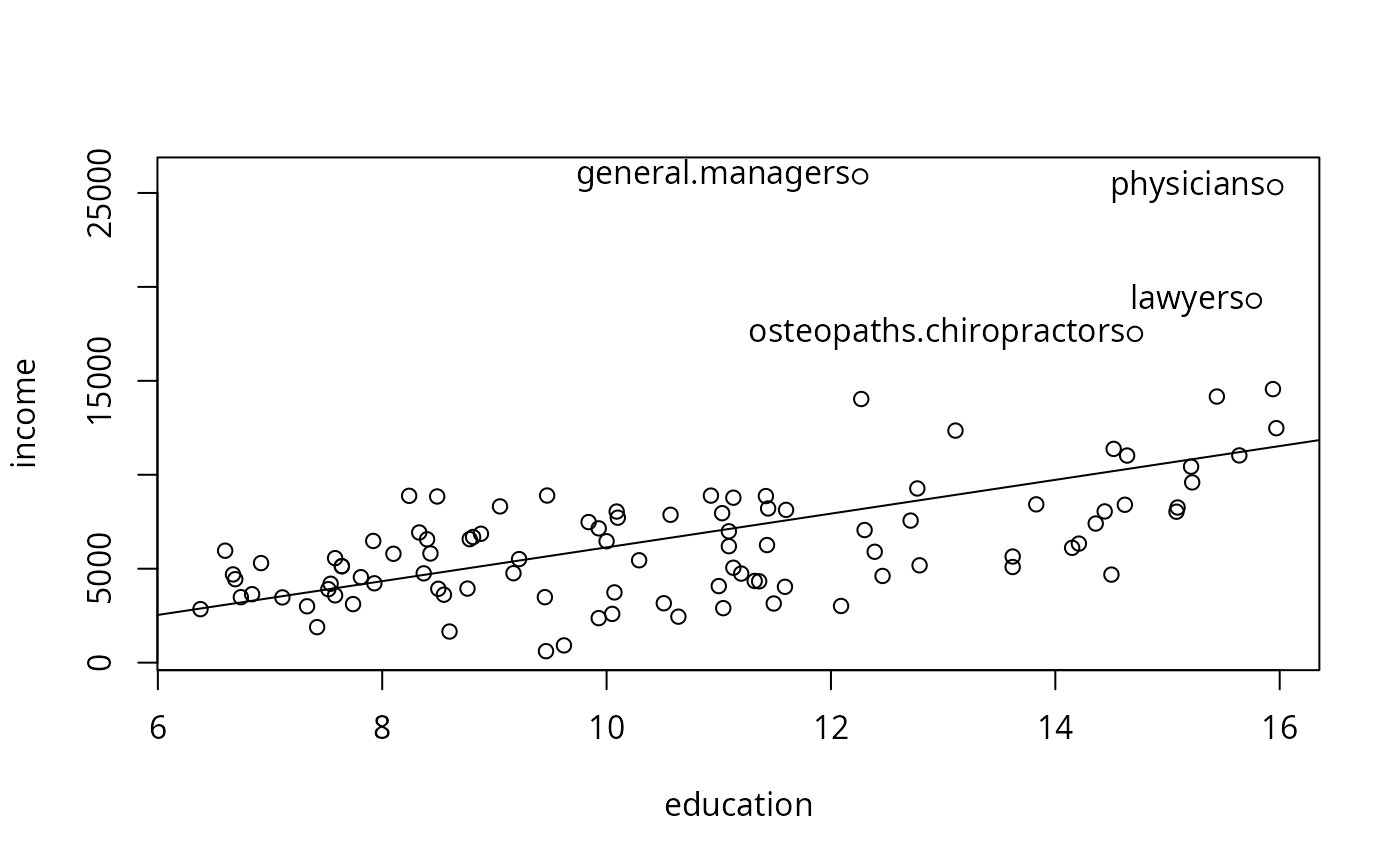 #> general.managers physicians lawyers
#> 2 24 17
#> osteopaths.chiropractors
#> 26
#> general.managers physicians lawyers
#> 2 24 17
#> osteopaths.chiropractors
#> 26