Empirical Cumulative Distribution Plot
Ecdf.RdComputes coordinates of cumulative distribution function of x, and by defaults
plots it as a step function. A grouping variable may be specified so that
stratified estimates are computed and (by default) plotted. If there is
more than one group, the labcurve function is used (by default) to label
the multiple step functions or to draw a legend defining line types, colors,
or symbols by linking them with group labels. A weights vector may
be specified to get weighted estimates. Specify normwt to make
weights sum to the length of x (after removing NAs). Other wise
the total sample size is taken to be the sum of the weights.
Ecdf is actually a method, and Ecdf.default is what's
called for a vector argument. Ecdf.data.frame is called when the
first argument is a data frame. This function can automatically set up
a matrix of ECDFs and wait for a mouse click if the matrix requires more
than one page. Categorical variables, character variables, and
variables having fewer than a set number of unique values are ignored.
If par(mfrow=..) is not set up before Ecdf.data.frame is
called, the function will try to figure the best layout depending on the
number of variables in the data frame. Upon return the original
mfrow is left intact.
When the first argument to Ecdf is a formula, a Trellis/Lattice function
Ecdf.formula is called. This allows for multi-panel
conditioning, superposition using a groups variable, and other
Trellis features, along with the ability to easily plot transformed
ECDFs using the fun argument. For example, if fun=qnorm,
the inverse normal transformation will be used for the y-axis. If the
transformed curves are linear this indicates normality. Like the
xYplot function, Ecdf will create a function Key if
the groups variable is used. This function can be invoked by the
user to define the keys for the groups.
Usage
Ecdf(x, ...)

# Default S3 method
Ecdf(x, what=c('F','1-F','f','1-f'),
     weights=rep(1, length(x)), normwt=FALSE,
     xlab, ylab, q, pl=TRUE, add=FALSE, lty=1,
     col=1, group=rep(1,length(x)), label.curves=TRUE, xlim,
     subtitles=TRUE, datadensity=c('none','rug','hist','density'),
     side=1,
     frac=switch(datadensity,none=NA,rug=.03,hist=.1,density=.1),
     dens.opts=NULL, lwd=1, log='', ...)


# S3 method for class 'data.frame'
Ecdf(x, group=rep(1,nrows),
     weights=rep(1, nrows), normwt=FALSE,
     label.curves=TRUE, n.unique=10, na.big=FALSE, subtitles=TRUE,
     vnames=c('labels','names'),...)

# S3 method for class 'formula'
Ecdf(x, data=sys.frame(sys.parent()), groups=NULL,
     prepanel=prepanel.Ecdf, panel=panel.Ecdf, ..., xlab,
     ylab, fun=function(x)x, what=c('F','1-F','f','1-f'), subset=TRUE)
Arguments
- x
a numeric vector, data frame, or Trellis/Lattice formula
- what
The default is
"F"which results in plotting the fraction of values <= x. Set to"1-F"to plot the fraction > x or"f"to plot the cumulative frequency of values <= x. Use"1-f"to plot the cumulative frequency of values >= x.- weights
numeric vector of weights. Omit or specify a zero-length vector or NULL to get unweighted estimates.
- normwt
see above
- xlab
x-axis label. Default is label(x) or name of calling argument. For
Ecdf.formula,xlabdefaults to thelabelattribute of the x-axis variable.- ylab
y-axis label. Default is
"Proportion <= x","Proportion > x", or "Frequency <= x" depending on value ofwhat.- q
a vector for quantiles for which to draw reference lines on the plot. Default is not to draw any.
- pl
set to F to omit the plot, to just return estimates
- add
set to TRUE to add the cdf to an existing plot. Does not apply if using lattice graphics (i.e., if a formula is given as the first argument).
- lty
integer line type for plot. If
groupis specified, this can be a vector.- lwd
line width for plot. Can be a vector corresponding to
groups.- log
see
plot. Setlog='x'to use log scale forx-axis.- col
color for step function. Can be a vector.
- group
a numeric, character, or
factorcategorical variable used for stratifying estimates. Ifgroupis present, as many ECDFs are drawn as there are non–missing group levels.- label.curves
applies if more than one
groupexists. Default isTRUEto uselabcurveto label curves where they are farthest apart. Setlabel.curvesto alistto specify options tolabcurve, e.g.,label.curves=list(method="arrow", cex=.8). These option names may be abbreviated in the usual way arguments are abbreviated. Use for examplelabel.curves=list(keys=1:5)to draw symbols periodically (as inpch=1:5- seepoints) on the curves and automatically position a legend in the most empty part of the plot. Setlabel.curves=FALSEto suppress drawing curve labels. Thecol,lty, andtypeparameters are automatically passed tolabcurve, although you can override them here. You can setlabel.curves=list(keys="lines")to have different line types defined in an automatically positioned key.- xlim
x-axis limits. Default is entire range of
x.- subtitles
set to
FALSEto suppress putting a subtitle at the bottom left of each plot. The subtitle indicates the numbers of non-missing and missing observations, which are labeledn,m.- datadensity
If
datadensityis not"none", eitherscat1dorhistSpikeis called to add a rug plot (datadensity="rug"), spike histogram (datadensity="hist"), or smooth density estimate ("density") to the bottom or top of the ECDF.- side
If
datadensityis not"none", the default is to place the additional information on top of the x-axis (side=1). Useside=3to place at the top of the graph.- frac
passed to
histSpike- dens.opts
a list of optional arguments for
histSpike- ...
other parameters passed to plot if add=F. For data frames, other parameters to pass to
Ecdf.default. ForEcdf.formula, ifgroupsis not used, you can also add data density information to each panel's ECDF by specifying thedatadensityand optionalfrac,side,dens.optsarguments.- n.unique
minimum number of unique values before an ECDF is drawn for a variable in a data frame. Default is 10.
- na.big
set to
TRUEto draw the number of NAs in larger letters in the middle of the plot forEcdf.data.frame- vnames
By default, variable labels are used to label x-axes. Set
vnames="names"to instead use variable names.- method
method for computing the empirical cumulative distribution. See
wtd.Ecdf. The default is to use the standard"i/n"method as is used by the non-Trellis versions ofEcdf.- fun
a function to transform the cumulative proportions, for the Trellis-type usage of
Ecdf- data, groups, subset,prepanel, panel
the usual Trellis/Lattice parameters, with
groupscausingEcdf.formulato overlay multiple ECDFs on one panel.
Value
for Ecdf.default an invisible list with elements x and y giving the
coordinates of the cdf. If there is more than one group, a list of
such lists is returned. An attribute, N, is in the returned
object. It contains the elements n and m, the number of
non-missing and missing observations, respectively.
Author
Frank Harrell
Department of Biostatistics, Vanderbilt University
fh@fharrell.com
Examples
set.seed(1)
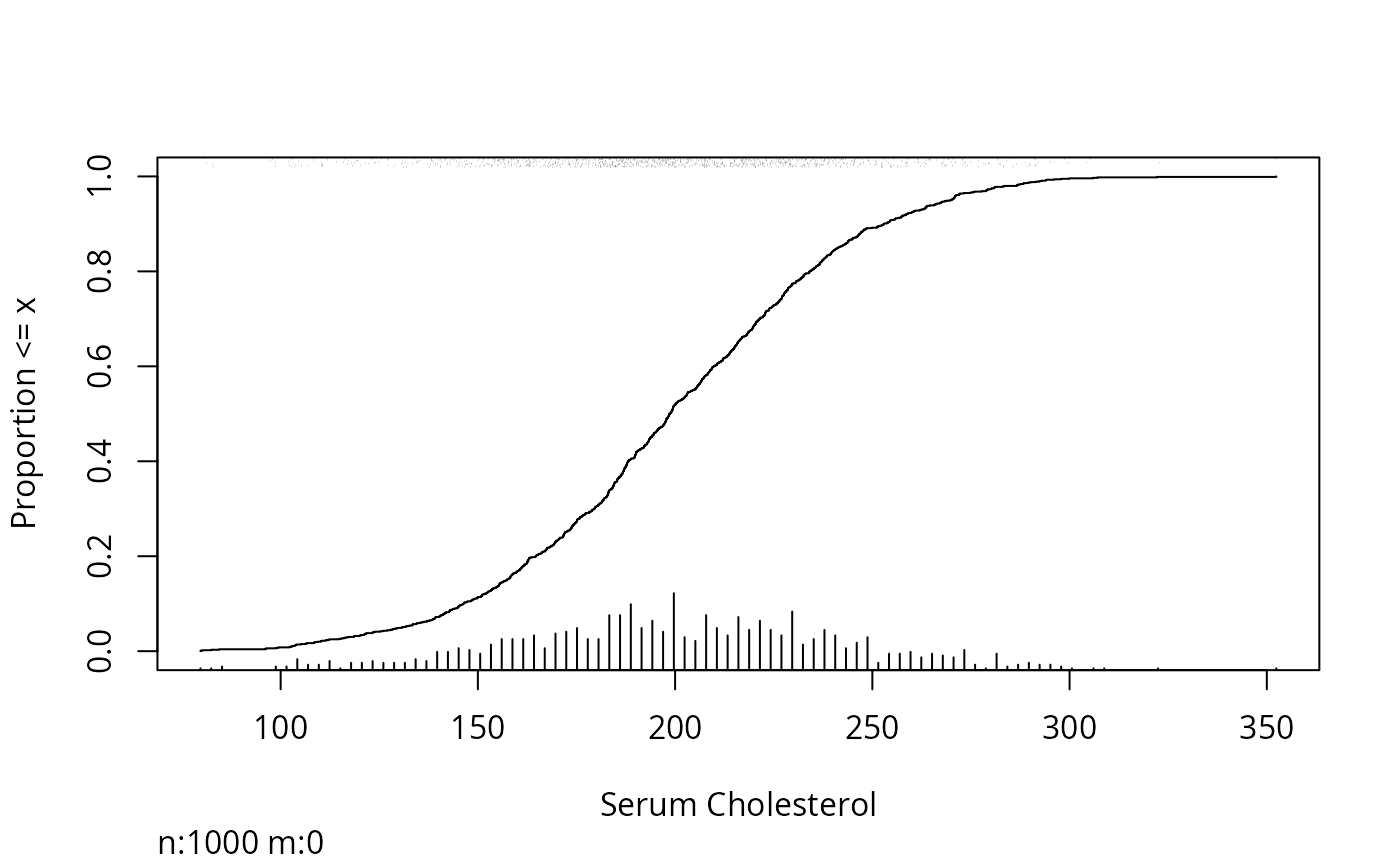
ch <- rnorm(1000, 200, 40)
Ecdf(ch, xlab="Serum Cholesterol")
scat1d(ch) # add rug plot
histSpike(ch, add=TRUE, frac=.15) # add spike histogram
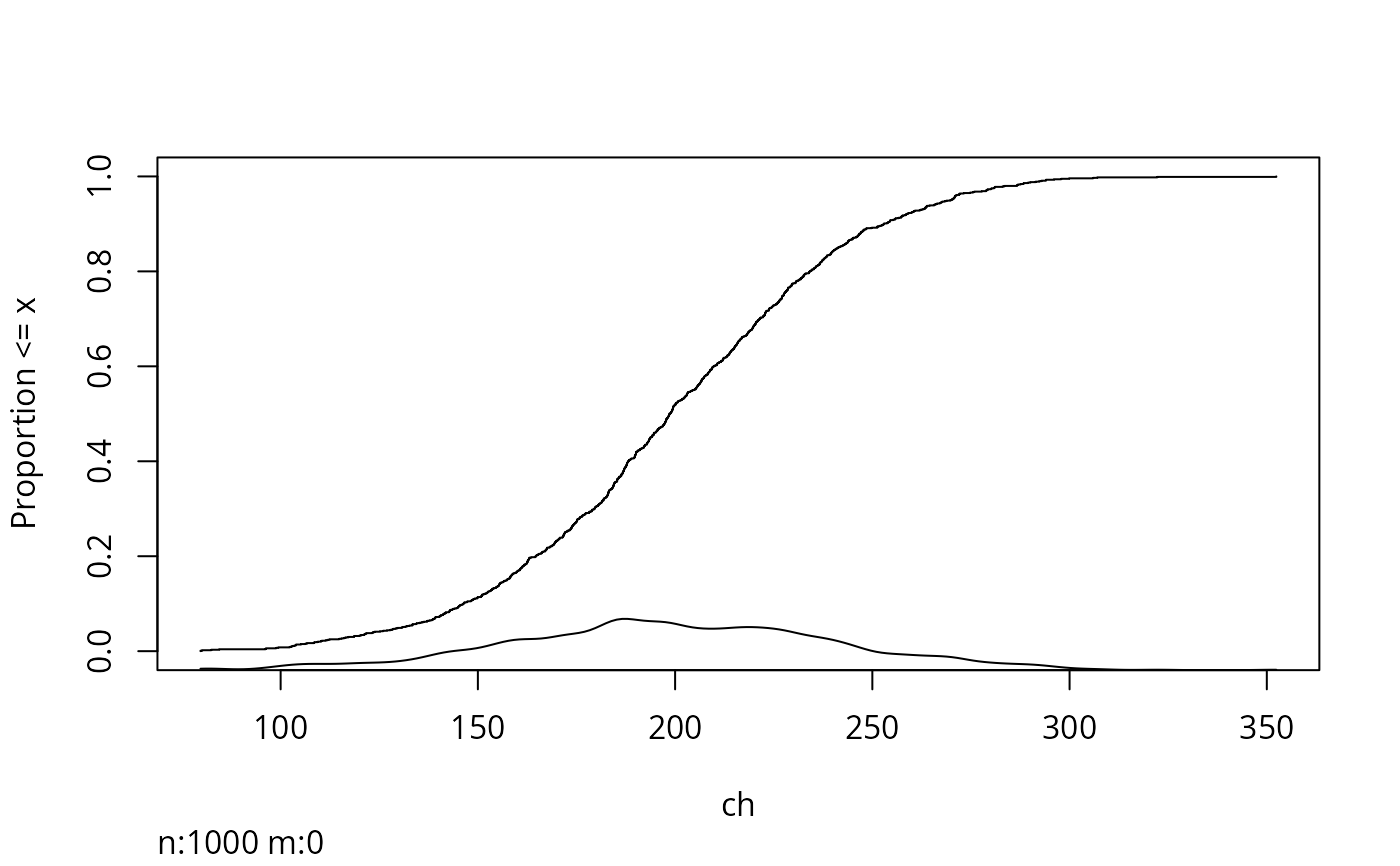
 # Better: add a data density display automatically:
Ecdf(ch, datadensity='density')
# Better: add a data density display automatically:
Ecdf(ch, datadensity='density')
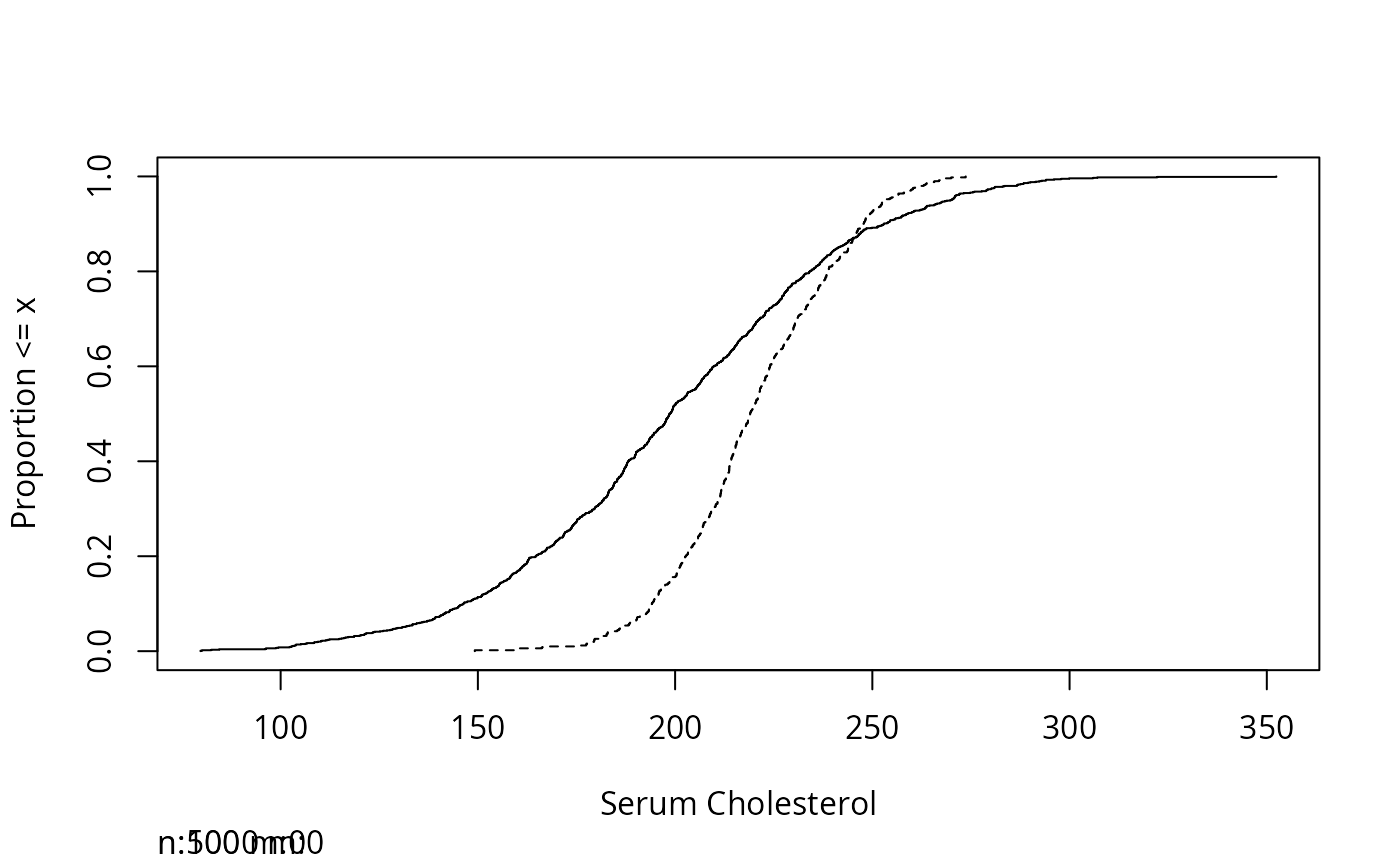
 label(ch) <- "Serum Cholesterol"
Ecdf(ch)
other.ch <- rnorm(500, 220, 20)
Ecdf(other.ch,add=TRUE,lty=2)
label(ch) <- "Serum Cholesterol"
Ecdf(ch)
other.ch <- rnorm(500, 220, 20)
Ecdf(other.ch,add=TRUE,lty=2)
 sex <- factor(sample(c('female','male'), 1000, TRUE))
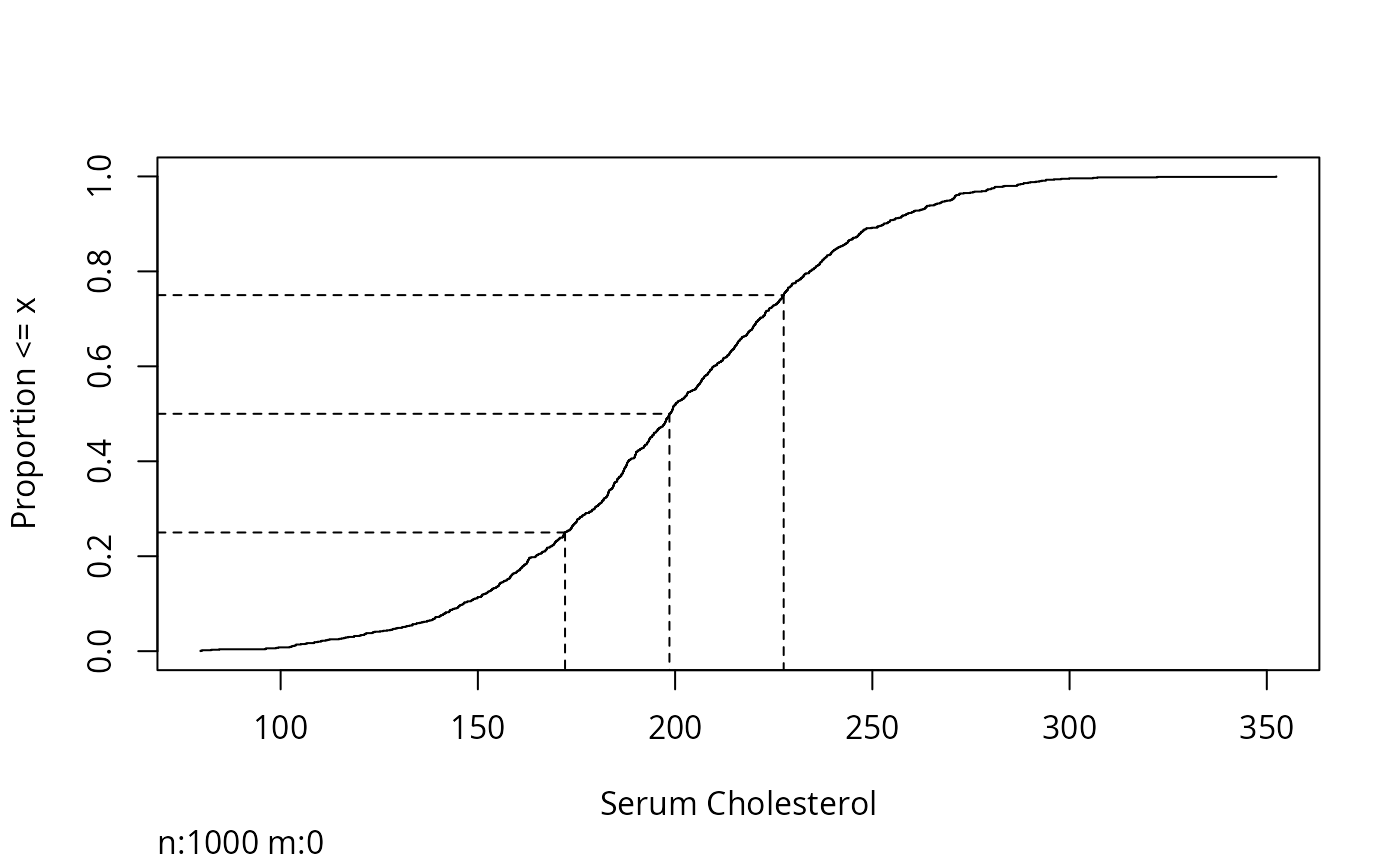
Ecdf(ch, q=c(.25,.5,.75)) # show quartiles
sex <- factor(sample(c('female','male'), 1000, TRUE))
Ecdf(ch, q=c(.25,.5,.75)) # show quartiles
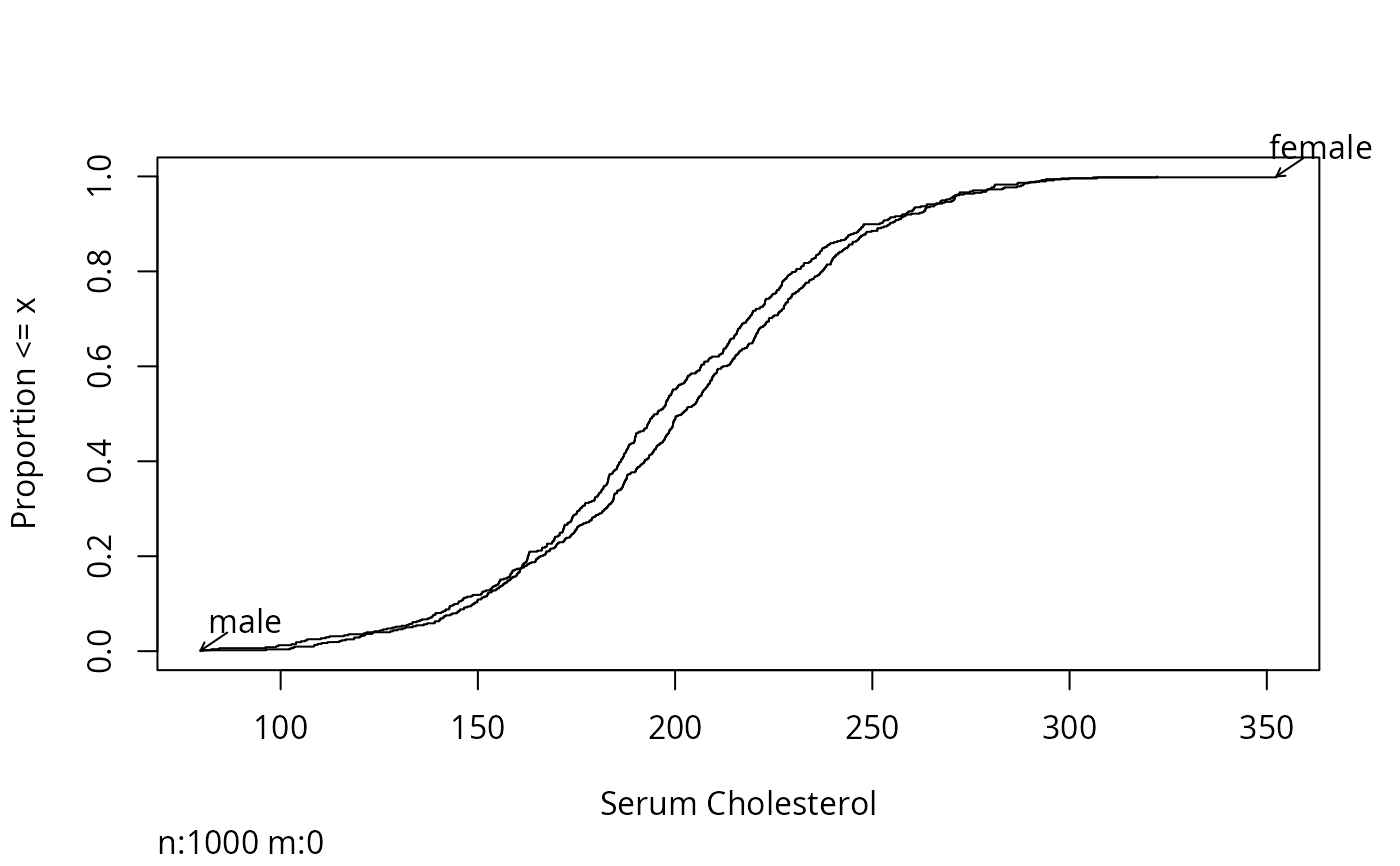
 Ecdf(ch, group=sex,
label.curves=list(method='arrow'))
#> Warning: collapsing to unique 'x' values
#> Warning: collapsing to unique 'x' values
Ecdf(ch, group=sex,
label.curves=list(method='arrow'))
#> Warning: collapsing to unique 'x' values
#> Warning: collapsing to unique 'x' values
 # Example showing how to draw multiple ECDFs from paired data
pre.test <- rnorm(100,50,10)
post.test <- rnorm(100,55,10)
x <- c(pre.test, post.test)
g <- c(rep('Pre',length(pre.test)),rep('Post',length(post.test)))
Ecdf(x, group=g, xlab='Test Results', label.curves=list(keys=1:2))
#> Warning: collapsing to unique 'x' values
#> Warning: collapsing to unique 'x' values
#> Warning: collapsing to unique 'x' values
#> Warning: collapsing to unique 'x' values
# Example showing how to draw multiple ECDFs from paired data
pre.test <- rnorm(100,50,10)
post.test <- rnorm(100,55,10)
x <- c(pre.test, post.test)
g <- c(rep('Pre',length(pre.test)),rep('Post',length(post.test)))
Ecdf(x, group=g, xlab='Test Results', label.curves=list(keys=1:2))
#> Warning: collapsing to unique 'x' values
#> Warning: collapsing to unique 'x' values
#> Warning: collapsing to unique 'x' values
#> Warning: collapsing to unique 'x' values
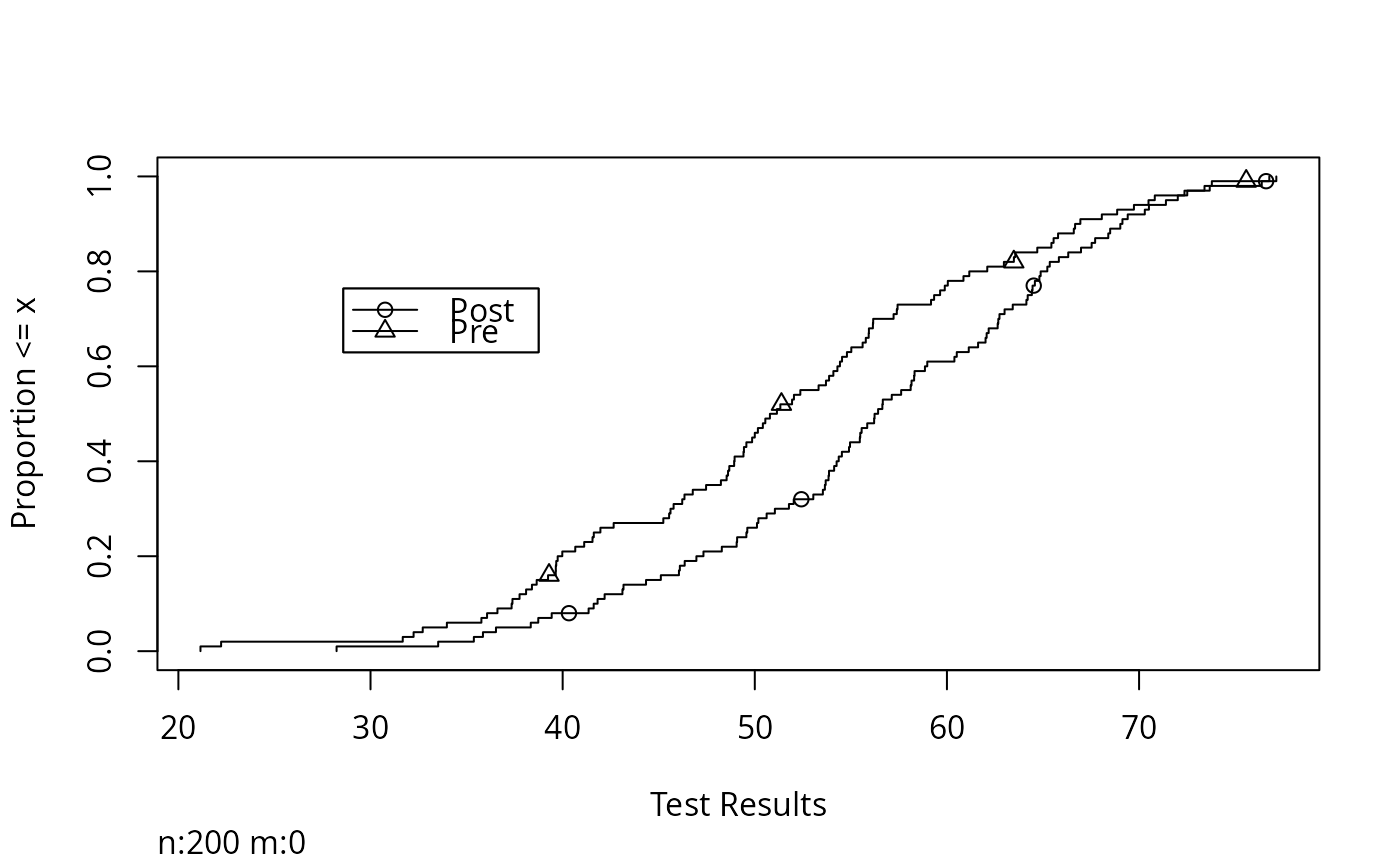 # keys=1:2 causes symbols to be drawn periodically on top of curves
# Draw a matrix of ECDFs for a data frame
m <- data.frame(pre.test, post.test,
sex=sample(c('male','female'),100,TRUE))
Ecdf(m, group=m$sex, datadensity='rug')
#> Warning: collapsing to unique 'x' values
#> Warning: collapsing to unique 'x' values
#> Warning: collapsing to unique 'x' values
#> Warning: collapsing to unique 'x' values
#> Warning: argument 1 does not name a graphical parameter
freqs <- sample(1:10, 1000, TRUE)
Ecdf(ch, weights=freqs) # weighted estimates
# Trellis/Lattice examples:
region <- factor(sample(c('Europe','USA','Australia'),100,TRUE))
year <- factor(sample(2001:2002,1000,TRUE))
Ecdf(~ch | region*year, groups=sex)
#> Warning: collapsing to unique 'x' values
#> Warning: collapsing to unique 'x' values
#> Warning: collapsing to unique 'x' values
#> Warning: collapsing to unique 'x' values
#> Warning: collapsing to unique 'x' values
#> Warning: collapsing to unique 'x' values
#> Warning: collapsing to unique 'x' values
#> Warning: collapsing to unique 'x' values
#> Warning: collapsing to unique 'x' values
#> Warning: collapsing to unique 'x' values
#> Warning: collapsing to unique 'x' values
#> Warning: collapsing to unique 'x' values
#> Warning: collapsing to unique 'x' values
#> Warning: collapsing to unique 'x' values
#> Warning: collapsing to unique 'x' values
#> Warning: collapsing to unique 'x' values
#> Warning: collapsing to unique 'x' values
#> Warning: collapsing to unique 'x' values
#> Warning: collapsing to unique 'x' values
#> Warning: collapsing to unique 'x' values
#> Warning: collapsing to unique 'x' values
#> Warning: collapsing to unique 'x' values
#> Warning: collapsing to unique 'x' values
#> Warning: collapsing to unique 'x' values
Key() # draw a key for sex at the default location
# Key(locator(1)) # user-specified positioning of key
age <- rnorm(1000, 50, 10)
Ecdf(~ch | lattice::equal.count(age), groups=sex) # use overlapping shingles
#> Warning: collapsing to unique 'x' values
#> Warning: collapsing to unique 'x' values
#> Warning: collapsing to unique 'x' values
#> Warning: collapsing to unique 'x' values
#> Warning: collapsing to unique 'x' values
#> Warning: collapsing to unique 'x' values
#> Warning: collapsing to unique 'x' values
#> Warning: collapsing to unique 'x' values
#> Warning: collapsing to unique 'x' values
#> Warning: collapsing to unique 'x' values
#> Warning: collapsing to unique 'x' values
#> Warning: collapsing to unique 'x' values
#> Warning: collapsing to unique 'x' values
#> Warning: collapsing to unique 'x' values
#> Warning: collapsing to unique 'x' values
#> Warning: collapsing to unique 'x' values
#> Warning: collapsing to unique 'x' values
#> Warning: collapsing to unique 'x' values
#> Warning: collapsing to unique 'x' values
#> Warning: collapsing to unique 'x' values
#> Warning: collapsing to unique 'x' values
#> Warning: collapsing to unique 'x' values
#> Warning: collapsing to unique 'x' values
#> Warning: collapsing to unique 'x' values
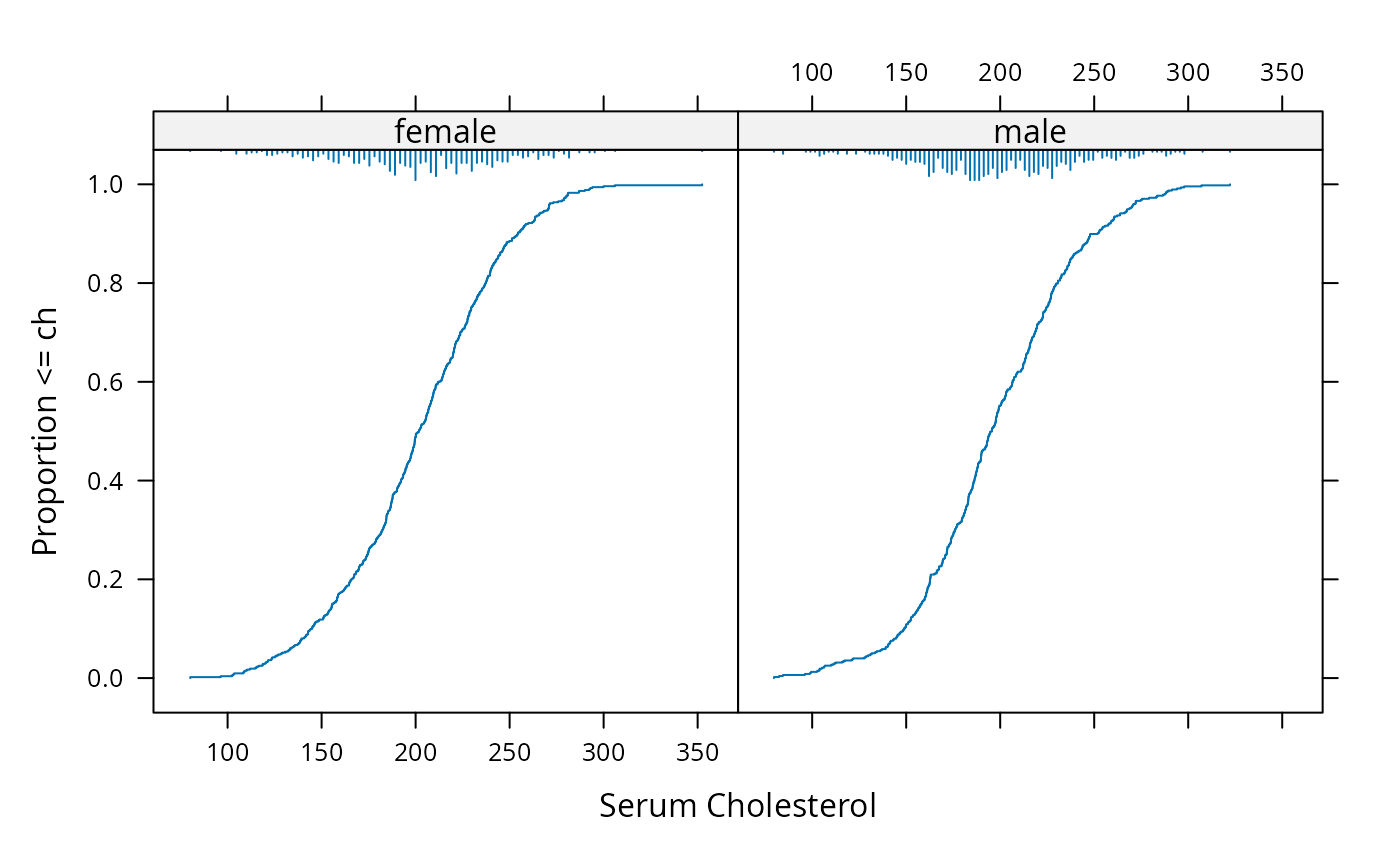
Ecdf(~ch | sex, datadensity='hist', side=3) # add spike histogram at top
# keys=1:2 causes symbols to be drawn periodically on top of curves
# Draw a matrix of ECDFs for a data frame
m <- data.frame(pre.test, post.test,
sex=sample(c('male','female'),100,TRUE))
Ecdf(m, group=m$sex, datadensity='rug')
#> Warning: collapsing to unique 'x' values
#> Warning: collapsing to unique 'x' values
#> Warning: collapsing to unique 'x' values
#> Warning: collapsing to unique 'x' values
#> Warning: argument 1 does not name a graphical parameter
freqs <- sample(1:10, 1000, TRUE)
Ecdf(ch, weights=freqs) # weighted estimates
# Trellis/Lattice examples:
region <- factor(sample(c('Europe','USA','Australia'),100,TRUE))
year <- factor(sample(2001:2002,1000,TRUE))
Ecdf(~ch | region*year, groups=sex)
#> Warning: collapsing to unique 'x' values
#> Warning: collapsing to unique 'x' values
#> Warning: collapsing to unique 'x' values
#> Warning: collapsing to unique 'x' values
#> Warning: collapsing to unique 'x' values
#> Warning: collapsing to unique 'x' values
#> Warning: collapsing to unique 'x' values
#> Warning: collapsing to unique 'x' values
#> Warning: collapsing to unique 'x' values
#> Warning: collapsing to unique 'x' values
#> Warning: collapsing to unique 'x' values
#> Warning: collapsing to unique 'x' values
#> Warning: collapsing to unique 'x' values
#> Warning: collapsing to unique 'x' values
#> Warning: collapsing to unique 'x' values
#> Warning: collapsing to unique 'x' values
#> Warning: collapsing to unique 'x' values
#> Warning: collapsing to unique 'x' values
#> Warning: collapsing to unique 'x' values
#> Warning: collapsing to unique 'x' values
#> Warning: collapsing to unique 'x' values
#> Warning: collapsing to unique 'x' values
#> Warning: collapsing to unique 'x' values
#> Warning: collapsing to unique 'x' values
Key() # draw a key for sex at the default location
# Key(locator(1)) # user-specified positioning of key
age <- rnorm(1000, 50, 10)
Ecdf(~ch | lattice::equal.count(age), groups=sex) # use overlapping shingles
#> Warning: collapsing to unique 'x' values
#> Warning: collapsing to unique 'x' values
#> Warning: collapsing to unique 'x' values
#> Warning: collapsing to unique 'x' values
#> Warning: collapsing to unique 'x' values
#> Warning: collapsing to unique 'x' values
#> Warning: collapsing to unique 'x' values
#> Warning: collapsing to unique 'x' values
#> Warning: collapsing to unique 'x' values
#> Warning: collapsing to unique 'x' values
#> Warning: collapsing to unique 'x' values
#> Warning: collapsing to unique 'x' values
#> Warning: collapsing to unique 'x' values
#> Warning: collapsing to unique 'x' values
#> Warning: collapsing to unique 'x' values
#> Warning: collapsing to unique 'x' values
#> Warning: collapsing to unique 'x' values
#> Warning: collapsing to unique 'x' values
#> Warning: collapsing to unique 'x' values
#> Warning: collapsing to unique 'x' values
#> Warning: collapsing to unique 'x' values
#> Warning: collapsing to unique 'x' values
#> Warning: collapsing to unique 'x' values
#> Warning: collapsing to unique 'x' values
Ecdf(~ch | sex, datadensity='hist', side=3) # add spike histogram at top