Label Attribute of an Object
label.Rdlabel(x) retrieves the label attribute of x.
label(x) <- "a label" stores the label attribute, and also puts
the class labelled as the first class of x (for S-Plus
this class is not used and methods for handling this class are
not defined so the "label" and "units" attributes are lost
upon subsetting). The reason for having this class is so that the
subscripting method for labelled, [.labelled, can preserve
the label attribute in S. Also, the print
method for labelled objects prefaces the print with the object's
label (and units if there). If the variable is also given
a "units" attribute using the units function, subsetting
the variable (using [.labelled) will also retain the
"units" attribute.
label can optionally append a "units" attribute to the
string, and it can optionally return a string or expression (for R's
plotmath facility) suitable for plotting. labelPlotmath
is a function that also has this function, when the input arguments are
the 'label' and 'units' rather than a vector having those
attributes. When plotmath mode is used to construct labels, the
'label' or 'units' may contain math expressions but they
are typed verbatim if they contain percent signs, blanks, or
underscores. labelPlotmath can optionally create the
expression as a character string, which is useful in building
ggplot commands.
For Surv objects, label first looks to see if there is
an overall "label" attribute for the object, then it looks for
saved attributes that Surv put in the "inputAttributes"
object, looking first at the event variable, then time2,
and finally time. You can restrict the looking by specifying
type.
labelLatex constructs suitable LaTeX labels a variable or from the
label and units arguments, optionally right-justifying
units if hfill=TRUE. This is useful when making tables
when the variable in question is not a column heading. If x
is specified, label and units values are extracted from
its attributes instead of from the other arguments.
Label (actually Label.data.frame) is a function which generates
S source code that makes the labels in all the variables in a data
frame easy to edit.
llist is like list except that it preserves the names or
labels of the component variables in the variables label
attribute. This can be useful when looping over variables or using
sapply or lapply. By using llist instead of
list one can annotate the output with the current variable's name
or label. llist also defines a names attribute for the
list and pulls the names from the arguments' expressions for
non-named arguments.
prList prints a list with element names (without the dollar
sign as in default list printing) and if an element of the list is an
unclassed list with a name, all of those elements are printed, with
titles of the form "primary list name : inner list name". This is
especially useful for Rmarkdown html notebooks when a user-written
function creates multiple html and graphical outputs to all be printed
in a code chunk. Optionally the names can be printed after the
object, and the htmlfig option provides more capabilities when
making html reports. prList does not work for regular html
documents.
putHfig is similar to prList but for a single graphical
object that is rendered with a print method, making it easy to
specify long captions, and short captions for the table of contents in
HTML documents.
Table of contents entries are generated with the short caption, which
is taken as the long caption if there is none. One can optionally not
make a table of contents entry. If argument table=TRUE table
captions will be produced instead. Using expcoll,
markupSpecs html function expcoll will be used to
make tables expand upon clicking an arrow rather than always appear.
putHcap is like putHfig except that it
assumes that users render the graphics or table outside of the
putHcap call. This allows things to work in ordinary html
documents. putHcap does not handle collapsed text.
plotmathTranslate is a simple function that translates certain
character strings to character strings that can be used as part of R
plotmath expressions. If the input string has a space or percent
inside, the string is surrounded by a call to plotmath's
paste function.
as.data.frame.labelled is a utility function that is called by
[.data.frame. It is just a copy of as.data.frame.vector.
data.frame.labelled is another utility function, that adds a
class "labelled" to every variable in a data frame that has a
"label" attribute but not a "labelled" class.
relevel.labelled is a method for preserving labels with the relevel function.
reLabelled is used to add a 'labelled' class back to
variables in data frame that have a 'label' attribute but no 'labelled'
class. Useful for changing cleanup.import()'d S-Plus data
frames back to general form for R and old versions of S-Plus.
Usage
label(x, default=NULL, ...)

# Default S3 method
label(x, default=NULL, units=plot, plot=FALSE,
      grid=FALSE, html=FALSE, ...)

# S3 method for class 'Surv'
label(x, default=NULL, units=plot, plot=FALSE,
      grid=FALSE, html=FALSE, type=c('any', 'time', 'event'), ...)

# S3 method for class 'data.frame'
label(x, default=NULL, self=FALSE, ...)

label(x, ...) <- value

# Default S3 method
label(x, ...) <- value

# S3 method for class 'data.frame'
label(x, self = TRUE, ...) <- value

labelPlotmath(label, units=NULL, plotmath=TRUE, html=FALSE, grid=FALSE,
              chexpr=FALSE)

labelLatex(x=NULL, label='', units='', size='smaller[2]',
           hfill=FALSE, bold=FALSE, default='', double=FALSE)

# S3 method for class 'labelled'
print(x, ...)   ## or x - calls print.labelled

Label(object, ...)

# S3 method for class 'data.frame'
Label(object, file='', append=FALSE, ...)

llist(..., labels=TRUE)

prList(x, lcap=NULL, htmlfig=0, after=FALSE)

putHfig(x, ..., scap=NULL, extra=NULL, subsub=TRUE, hr=TRUE,
        table=FALSE, file='', append=FALSE, expcoll=NULL)

putHcap(..., scap=NULL, extra=NULL, subsub=TRUE, hr=TRUE,
        table=FALSE, file='', append=FALSE)

plotmathTranslate(x)

data.frame.labelled(object)

# S3 method for class 'labelled'
relevel(x, ...)

reLabelled(object)

combineLabels(...)
Arguments
- x
any object (for
plotmathTranslateis a character string). Forrelevelis afactorvariable. ForprListis a named list. ForputHfigis a graphical object for which aprintmethod will render the graphic (e.g., aggplot2orplotlyobject).- self
lgoical, where to interact with the object or its components
- units
set to
TRUEto append the'units'attribute (if present) to the returned label. The'units'are surrounded by brackets. ForlabelPlotmathandlabelLatexis a character string containing the units of measurement. WhenplotisTRUE,unitsdefaults toTRUE.- plot
set to
TRUEto return a label suitable for R'splotmathfacility (returns an expression instead of a character string) if R is in effect. Ifunitsis alsoTRUE, and if both'label'and'units'attributes are present, the'units'will appear after the label but in smaller type and will not be surrounded by brackets.- default
if
xdoes not have a'label'attribute anddefault(a character string) is specified, the label will be taken asdefault. ForlabelLatexthedefaultis the name of the first argument if it is a variable and not a label.- grid
Currently R's
latticeandgridfunctions do not supportplotmathexpressions forxlabandylabarguments. When usinglatticefunctions in R, set the argumentgridtoTRUEso thatlabelPlotmathcan return an ordinary character string instead of an expression.- html
set to
TRUEto use HTML formatting instead of plotmath expressions for constructing labels with units- type
for
Survobjects specifies the type of element for which to restrict the search for a label- label
a character string containing a variable's label
- plotmath
set to
TRUEto havelabelMathplotreturn an expression for plotting using R'splotmathfacility. If R is not in effect, an ordinary character string is returned.- chexpr
set to
TRUEto havelabelPlotmathreturn a character string of the form"expression(...)"- size
LaTeX size for
units. Default is two sizes smaller thanlabel, which assumes that the LaTeXrelsizepackage is in use.- hfill
set to
TRUEto right-justifyunitsin the field. This is useful when multiple labels are being put into rows in a LaTeXtabularenvironment, and will cause a problem if the label is used in an environment wherehfillis not appropriate.- bold
set to
TRUEto havelabelLatexput thelabelin bold face.- double
set to
TRUEto represent backslash in LaTeX as four backslashes in place of two. This is needed if, for example, you need to convert the result usingas.formula- value
the label of the object, or "".
- object
a data frame
- ...
a list of variables or expressions to be formed into a
list. Ignored forprint.labelled. Forrelevelis thelevel(a single character string) to become the new reference (first) category. ForputHfigandputHcaprepresents one or more character strings that are pasted together, separated by a blank.- file
the name of a file to which to write S source code. Default is
"", meaning standard output. ForputHcap, setfiletoFALSEto return a character vector instead of writing tofile.- append
set to
TRUEto append code generated byLabelto filefile. Also used forputHfig, putHcap.- labels
set to
FALSEto makellistignore the variables'labelattribute and use the variables' names.- lcap
an optional vector of character strings corresponding to elements in
xforprList. These contain long captions that do not appear in the table of contents but which are printed right after the short caption in the body, in the same font.- htmlfig
for
prListset to1to use HTML markup by running the object names throughmarkupSpecs$html$capfor figure captions. Sethtmlfig=2to also preface the figure caption with"### "so that it will appear in the table of contents.- after
set to
TRUEto haveprListput names after the printed object instead of before- scap
a character string specifying the short (or possibly only) caption.
- extra
an optional vector of character strings. When present the long caption will be put in the first column of an HTML table and the elements of
extrain subsequent columns. This allows extra information to appear in the long caption in a way that is right-justified to the right of the flowing caption text.- subsub
set to
FALSEto suppress"### "from being placed in front of the short caption. Set it to different character string to use that instead. Set it to""to ignore short captions entirely. For example to use second-level headings for the table of contents specifysubsub="## ".- hr
applies if a caption is present. Specify
FALSEto not put a horizontal line before the caption and figure.- table
set to
TRUEto produce table captions instead of figure captions- expcoll
character string to be visible, with a clickable arrow following to allow initial hiding of a table and its captions. Cannot be used with
table=FALSE.
Value
label returns the label attribute of x, if any; otherwise, "".
label is used
most often for the individual variables in data frames. The function
sas.get copies labels over from SAS if they exist.
See also
sas.get, describe,
extractlabs, hlab
Examples
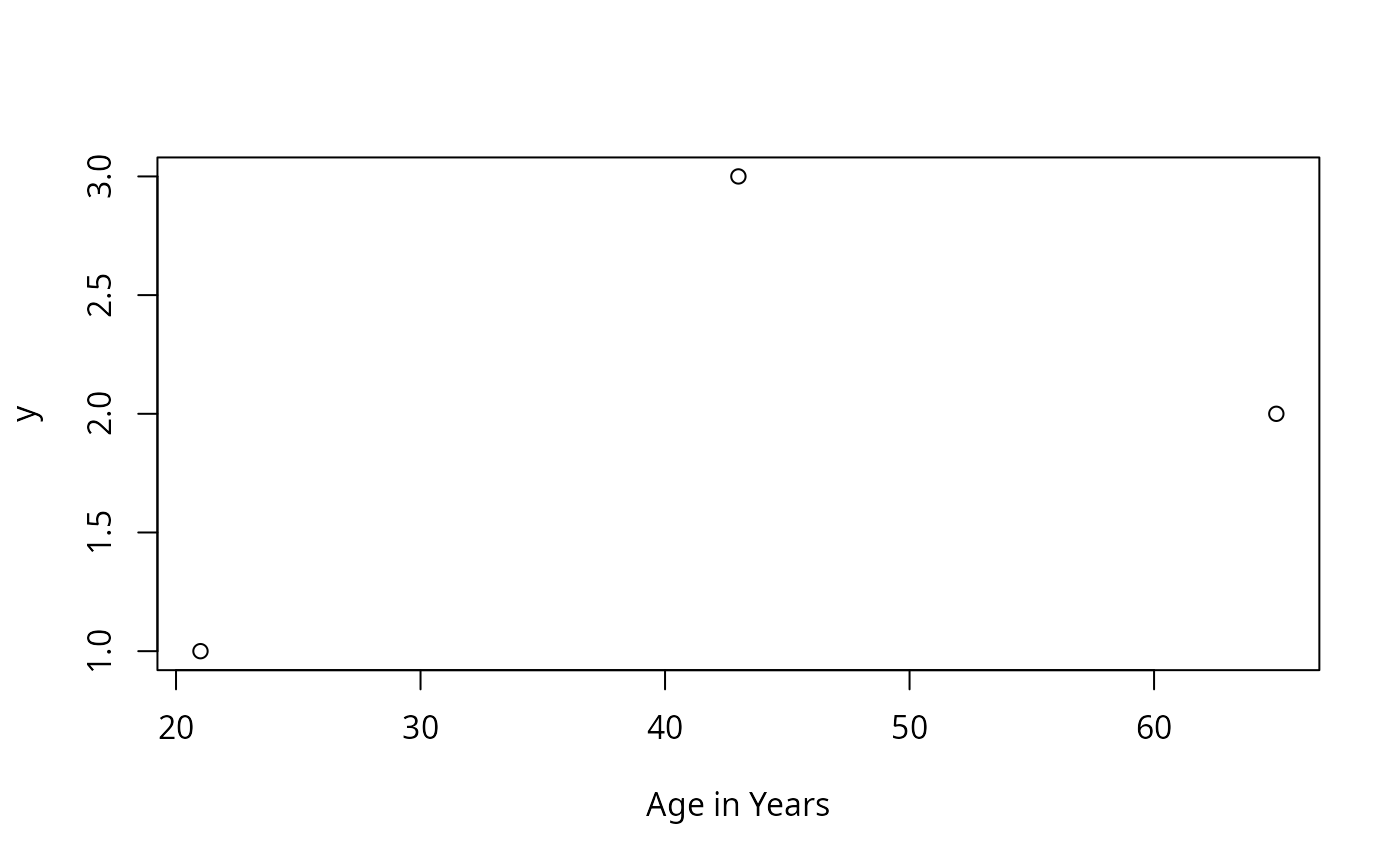
age <- c(21,65,43)
y <- 1:3
label(age) <- "Age in Years"
plot(age, y, xlab=label(age))
 data <- data.frame(age=age, y=y)
label(data)
#> age y
#> "Age in Years" ""
label(data, self=TRUE) <- "A data frame"
label(data, self=TRUE)
#> [1] "A data frame"
x1 <- 1:10
x2 <- 10:1
label(x2) <- 'Label for x2'
units(x2) <- 'mmHg'
x2
#> Label for x2 [mmHgs]
#> [1] 10 9 8 7 6 5 4 3 2 1
x2[1:5]
#> Label for x2 [mmHgs]
#> [1] 10 9 8 7 6
dframe <- data.frame(x1, x2)
Label(dframe)
#> label(x1) <- ''
#> label(x2) <- 'Label for x2'
labelLatex(x2, hfill=TRUE, bold=TRUE)
#> [1] "{\\textbf Label for x2}\\hfill {\\smaller[2] mmHg}"
labelLatex(label='Velocity', units='m/s')
#> [1] "Velocity {\\smaller[2] m/s}"
##In these examples of llist, note that labels are printed after
##variable names, because of print.labelled
a <- 1:3
b <- 4:6
label(b) <- 'B Label'
llist(a,b)
#> $a
#> a
#> [1] 1 2 3
#>
#> $b
#> B Label
#> [1] 4 5 6
#>
llist(a,b,d=0)
#> $a
#> a
#> [1] 1 2 3
#>
#> $b
#> B Label
#> [1] 4 5 6
#>
#> $d
#> d
#> [1] 0
#>
llist(a,b,0)
#> $a
#> a
#> [1] 1 2 3
#>
#> $b
#> B Label
#> [1] 4 5 6
#>
#> $`0`
#> 0
#> [1] 0
#>
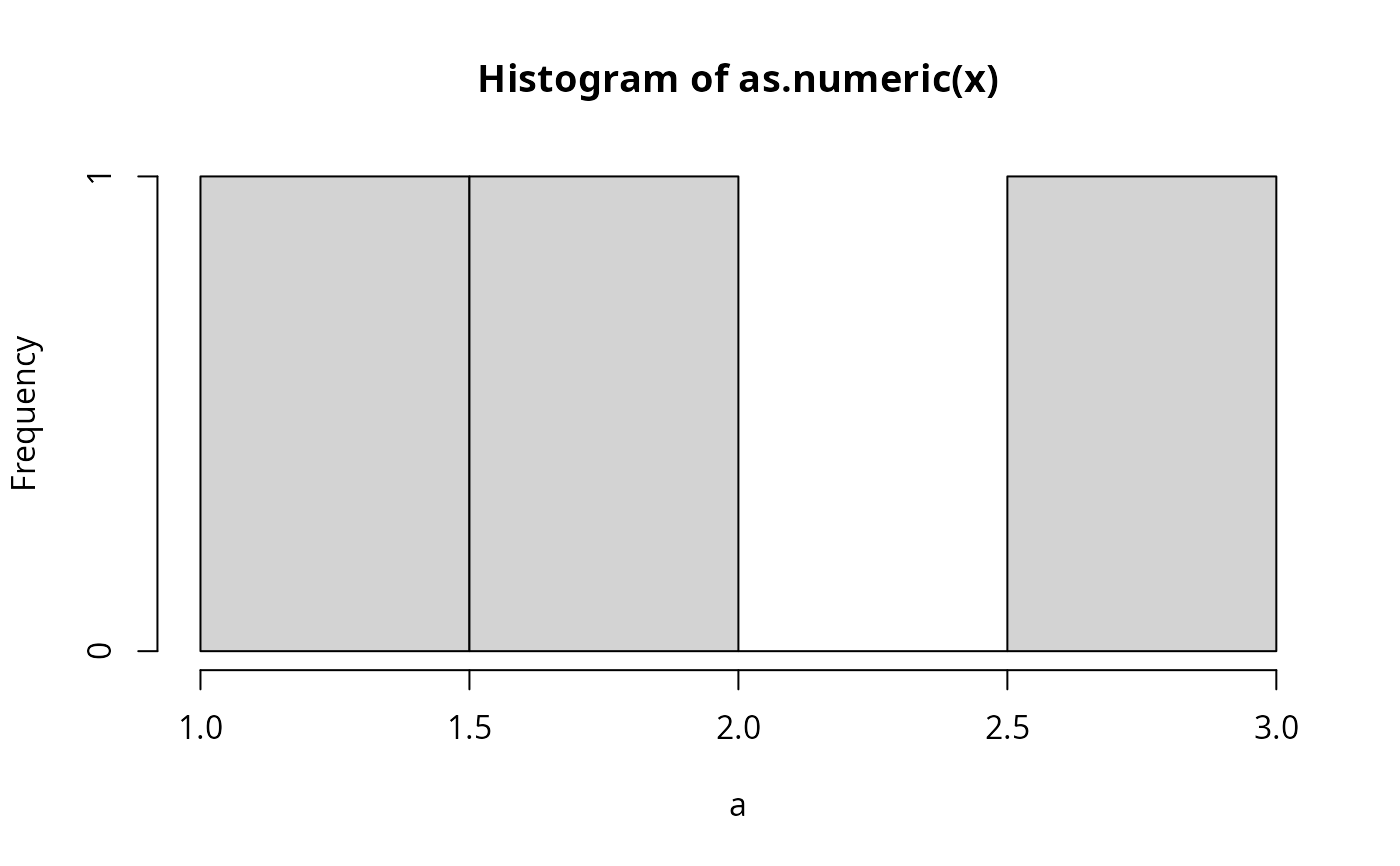
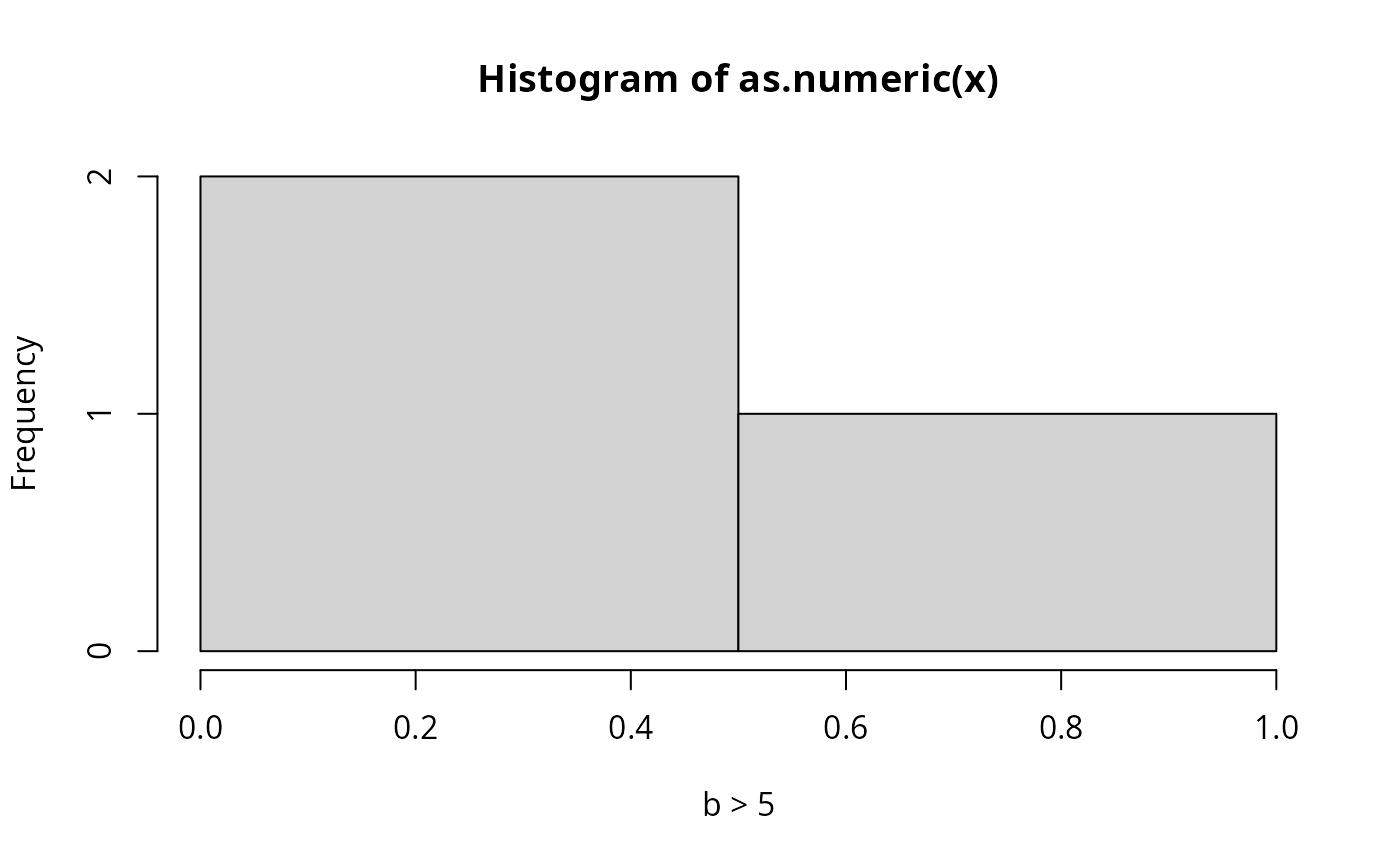
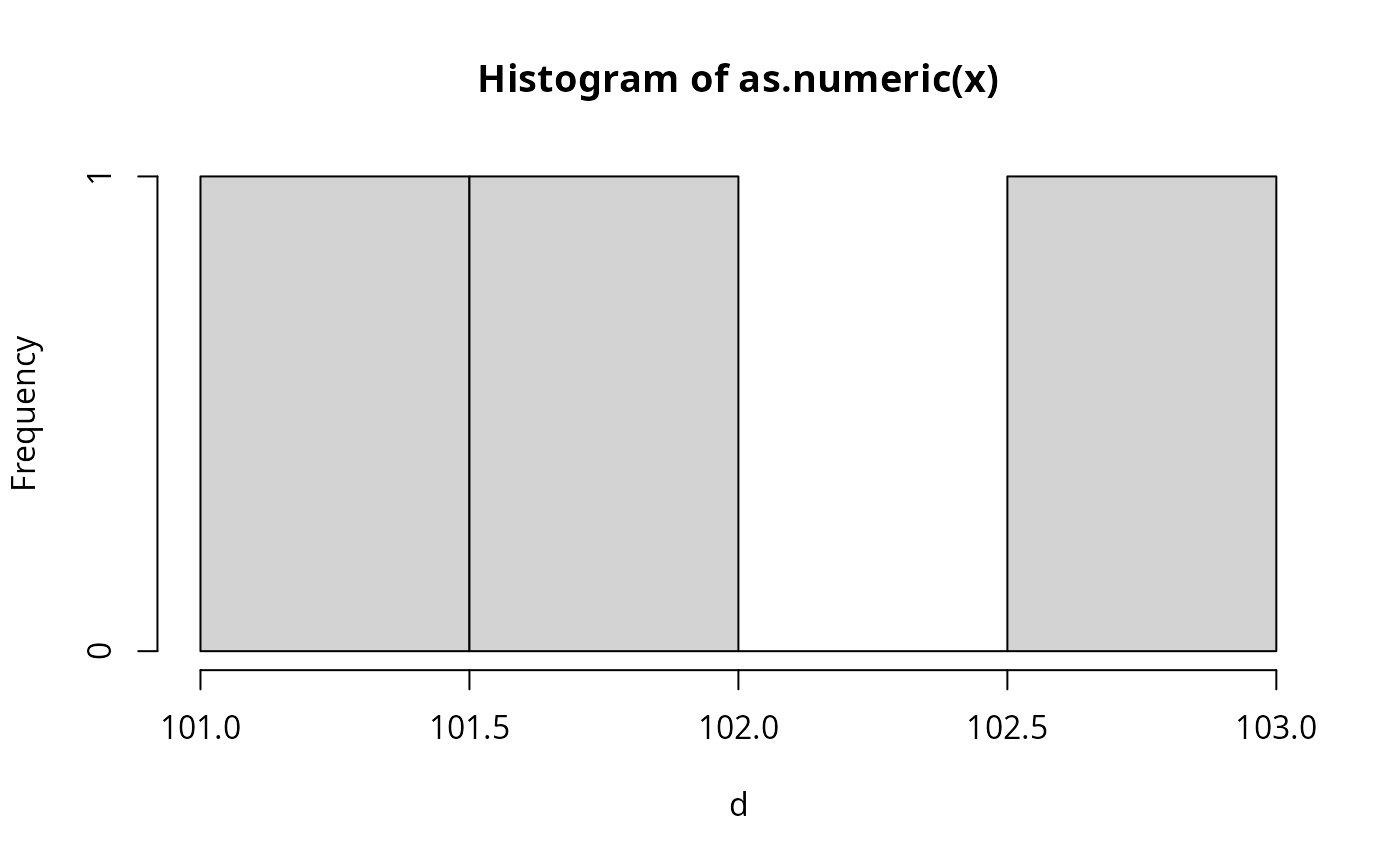
w <- llist(a, b>5, d=101:103)
sapply(w, function(x){
hist(as.numeric(x), xlab=label(x))
# locator(1) ## wait for mouse click
})
data <- data.frame(age=age, y=y)
label(data)
#> age y
#> "Age in Years" ""
label(data, self=TRUE) <- "A data frame"
label(data, self=TRUE)
#> [1] "A data frame"
x1 <- 1:10
x2 <- 10:1
label(x2) <- 'Label for x2'
units(x2) <- 'mmHg'
x2
#> Label for x2 [mmHgs]
#> [1] 10 9 8 7 6 5 4 3 2 1
x2[1:5]
#> Label for x2 [mmHgs]
#> [1] 10 9 8 7 6
dframe <- data.frame(x1, x2)
Label(dframe)
#> label(x1) <- ''
#> label(x2) <- 'Label for x2'
labelLatex(x2, hfill=TRUE, bold=TRUE)
#> [1] "{\\textbf Label for x2}\\hfill {\\smaller[2] mmHg}"
labelLatex(label='Velocity', units='m/s')
#> [1] "Velocity {\\smaller[2] m/s}"
##In these examples of llist, note that labels are printed after
##variable names, because of print.labelled
a <- 1:3
b <- 4:6
label(b) <- 'B Label'
llist(a,b)
#> $a
#> a
#> [1] 1 2 3
#>
#> $b
#> B Label
#> [1] 4 5 6
#>
llist(a,b,d=0)
#> $a
#> a
#> [1] 1 2 3
#>
#> $b
#> B Label
#> [1] 4 5 6
#>
#> $d
#> d
#> [1] 0
#>
llist(a,b,0)
#> $a
#> a
#> [1] 1 2 3
#>
#> $b
#> B Label
#> [1] 4 5 6
#>
#> $`0`
#> 0
#> [1] 0
#>
w <- llist(a, b>5, d=101:103)
sapply(w, function(x){
hist(as.numeric(x), xlab=label(x))
# locator(1) ## wait for mouse click
})
 #> a b > 5 d
#> breaks numeric,5 numeric,3 numeric,5
#> counts integer,4 integer,2 integer,4
#> density numeric,4 numeric,2 numeric,4
#> mids numeric,4 numeric,2 numeric,4
#> xname "as.numeric(x)" "as.numeric(x)" "as.numeric(x)"
#> equidist TRUE TRUE TRUE
# Or: for(u in w) {hist(u); title(label(u))}
#> a b > 5 d
#> breaks numeric,5 numeric,3 numeric,5
#> counts integer,4 integer,2 integer,4
#> density numeric,4 numeric,2 numeric,4
#> mids numeric,4 numeric,2 numeric,4
#> xname "as.numeric(x)" "as.numeric(x)" "as.numeric(x)"
#> equidist TRUE TRUE TRUE
# Or: for(u in w) {hist(u); title(label(u))}