adds a colored and rotated rectangle to a plot
filledrectangle.Rdplots and colors a rotated rectangle; color can be a palette
Arguments
- mid
midpoint of rectangle.
- wx
horizontal width.
- wy
vertical width.
- col
color palette to be used; also allowed are two extremes or one value.
- values
if not
NULL, a matrix providing (radius,z-values) couples, used for coloring.- zlim
Only if values is not NULL: the minimum and maximum z values for which colors should be plotted, defaulting to the range of the finite values of the second column of
values.- lwd
width of external line.
- lcol
line color.
- angle
angle of rotation, in degrees.
- ...
arguments passed to R-function polygon.
Details
If angle=0, coloration starts from top to bottom. This is different
from filledmultigonal,
where coloration proceeds from middle to external
wx,wy: horizontal and vertical width of the shape
Here "horizontal" and "vertical" denote the position BEFORE rotation
values: if not NULL, a matrix providing (radius,z-values)
couples, used for coloring.
Here radius are positive values denoting the relative distance between
the shapes centre and edge.
The radiusses are rescaled to be in [0,1] if needed.
z-values (2nd column of values) together with zlim and
col denote the coloration level.
Colors in col will be interpolated to the z-values and used to
color an interval as given by the input radiusses.
See also
Examples
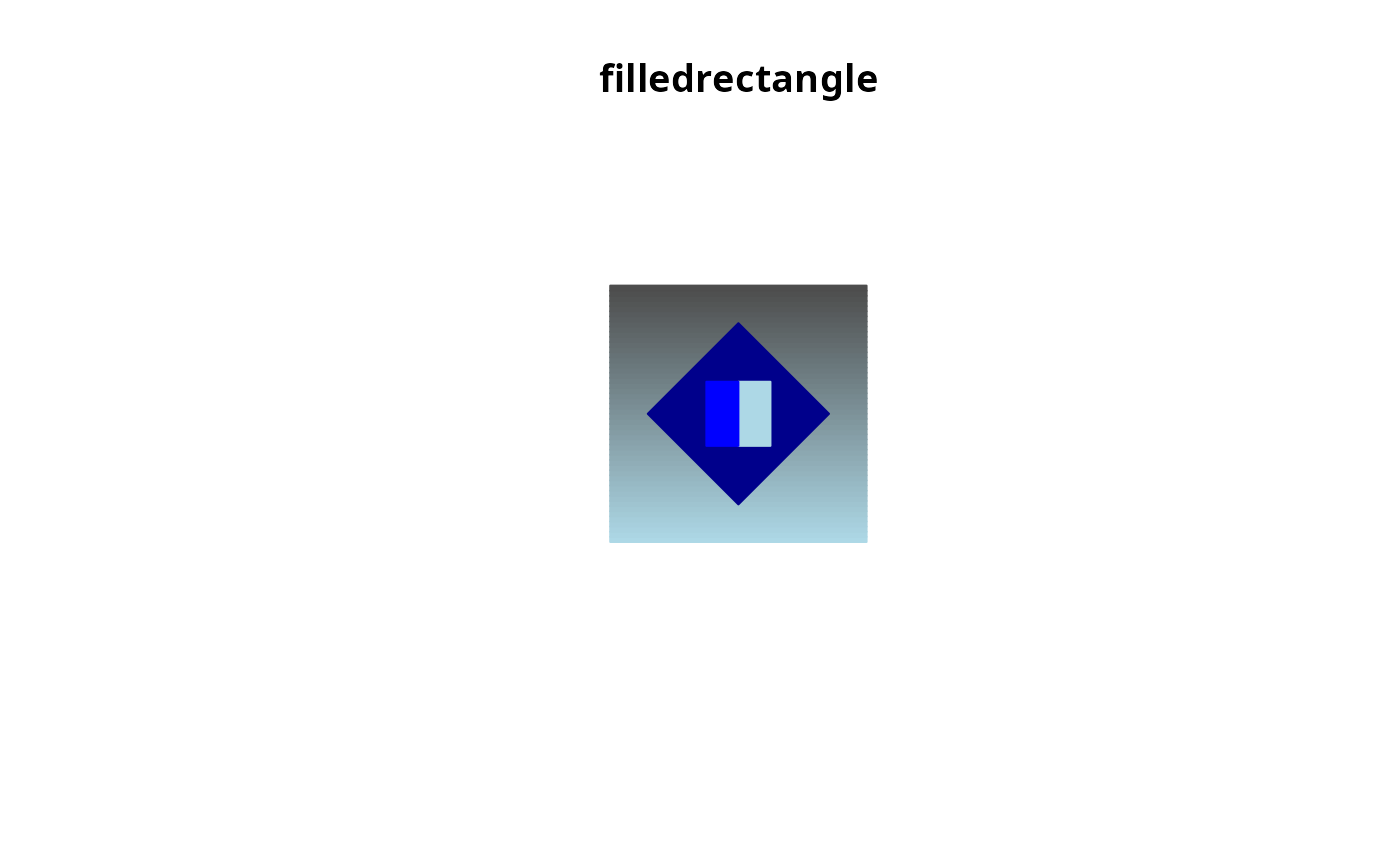
color <- shadepalette(grey(0.3), "lightblue", n = 50)
emptyplot(main = "filledrectangle")
filledrectangle(wx = 0.5, wy = 0.5, col = color,
mid = c(0.5, 0.5), angle = 0)
filledrectangle(wx = 0.25, wy = 0.25, col = "darkblue",
mid = c(0.5, 0.5), angle = 45)
filledrectangle(wx = 0.125, wy = 0.125, col = c("lightblue","blue"),
mid = c(0.5, 0.5), angle = 90)
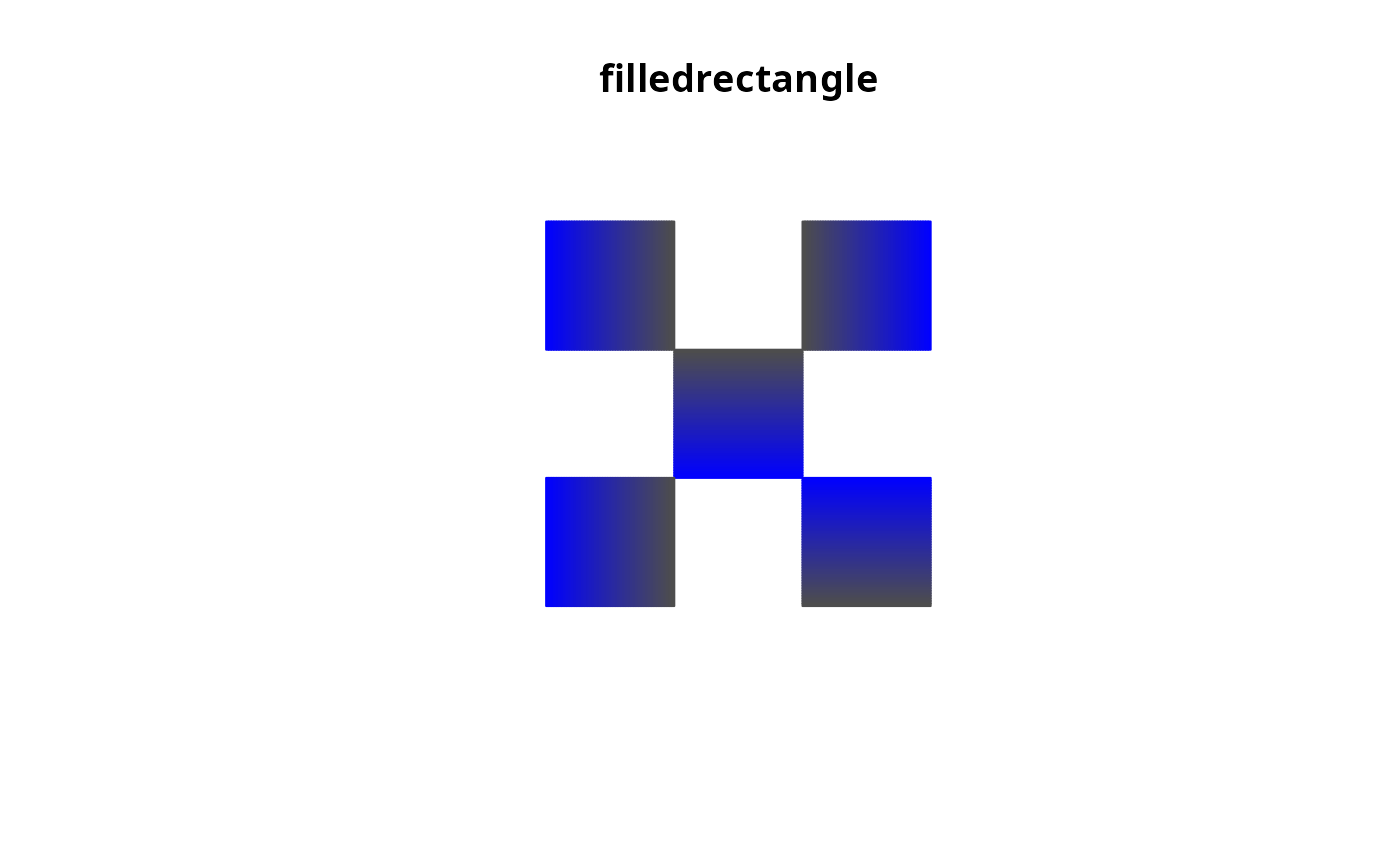
 color <- shadepalette(grey(0.3), "blue", n = 50)
emptyplot(c(-1, 1), main = "filledrectangle")
filledrectangle(wx = 0.5, wy = 0.5, col = color,
mid = c(0, 0), angle = 0)
filledrectangle(wx = 0.5, wy = 0.5, col = color,
mid = c(0.5, 0.5), angle = 90)
filledrectangle(wx = 0.5, wy = 0.5, col = color,
mid = c(-0.5, -0.5), angle = -90)
filledrectangle(wx = 0.5, wy = 0.5, col = color,
mid = c(0.5, -0.5), angle = 180)
filledrectangle(wx = 0.5, wy = 0.5, col = color,
mid = c(-0.5, 0.5), angle = 270)
color <- shadepalette(grey(0.3), "blue", n = 50)
emptyplot(c(-1, 1), main = "filledrectangle")
filledrectangle(wx = 0.5, wy = 0.5, col = color,
mid = c(0, 0), angle = 0)
filledrectangle(wx = 0.5, wy = 0.5, col = color,
mid = c(0.5, 0.5), angle = 90)
filledrectangle(wx = 0.5, wy = 0.5, col = color,
mid = c(-0.5, -0.5), angle = -90)
filledrectangle(wx = 0.5, wy = 0.5, col = color,
mid = c(0.5, -0.5), angle = 180)
filledrectangle(wx = 0.5, wy = 0.5, col = color,
mid = c(-0.5, 0.5), angle = 270)