adds a colored shape to a plot
filledshape.Rdplots outer and inner shape and colors inbetween; color can be a palette
Arguments
- xyouter
2-column matrix with x,y values of outer shape.
- xyinner
2-column matrix of 2-valued vector with x,y values of inner shape; default is centroid of
xyouter.- col
color palette to be used; also allowed are two extremes.
- values
if not
NULL, a matrix providing (radius,z-values) couples, used for coloring.- zlim
Only if
valuesis notNULL: the minimum and maximum z values for which colors should be plotted, defaulting to the range of the finite values of the second column of *values*.- lcol
line color.
- lwd
width of external line, only if
lcol!=NA.- ...
arguments passed to R-function polygon
Details
draws and outer and inner shape, as specified in xyouter, and
xyinner and fills with a palette of colors inbetween;
values: if not null, a matrix providing (radius,z-values) couples,
used for coloring.
Here radius are positive values denoting the relative distance between
the shapes centre and edge.
The radiusses are rescaled to be in [0,1] if needed.
z-values (2nd column of values) together with zlim and
col denote the coloration level.
Colors in col will be interpolated to the z-values and used to
color an interval as given by the input radiusses.
If xyinner is a point, the shape is full.
See also
Examples
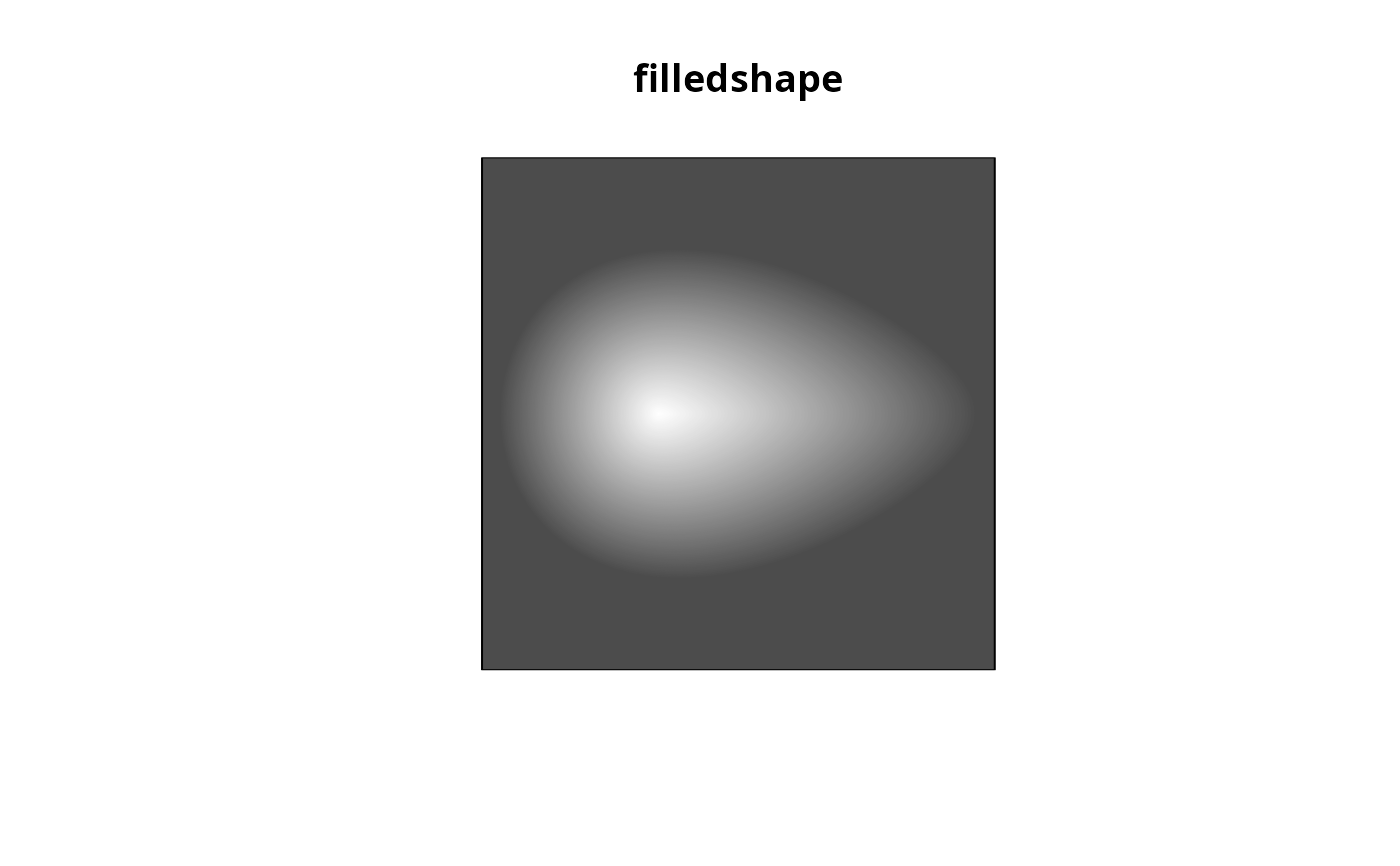
#an egg
color <-greycol(100)
emptyplot(c(-3.2, 3.2), col = color[length(color)], main = "filledshape")
b <- 4
a <- 9
x <- seq(-sqrt(a), sqrt(a), by = 0.01)
g <- b-b/a*x^2 - 0.2*b*x + 0.2*b/a*x^3
g[g<0] <- 0
x1 <- c(x, rev(x))
g1 <- c(sqrt(g), rev(-sqrt(g)))
xouter <- cbind(x1, g1)
xouter <- rbind(xouter, xouter[1,])
filledshape(xouter, xyinner = c(-1, 0), col = color)
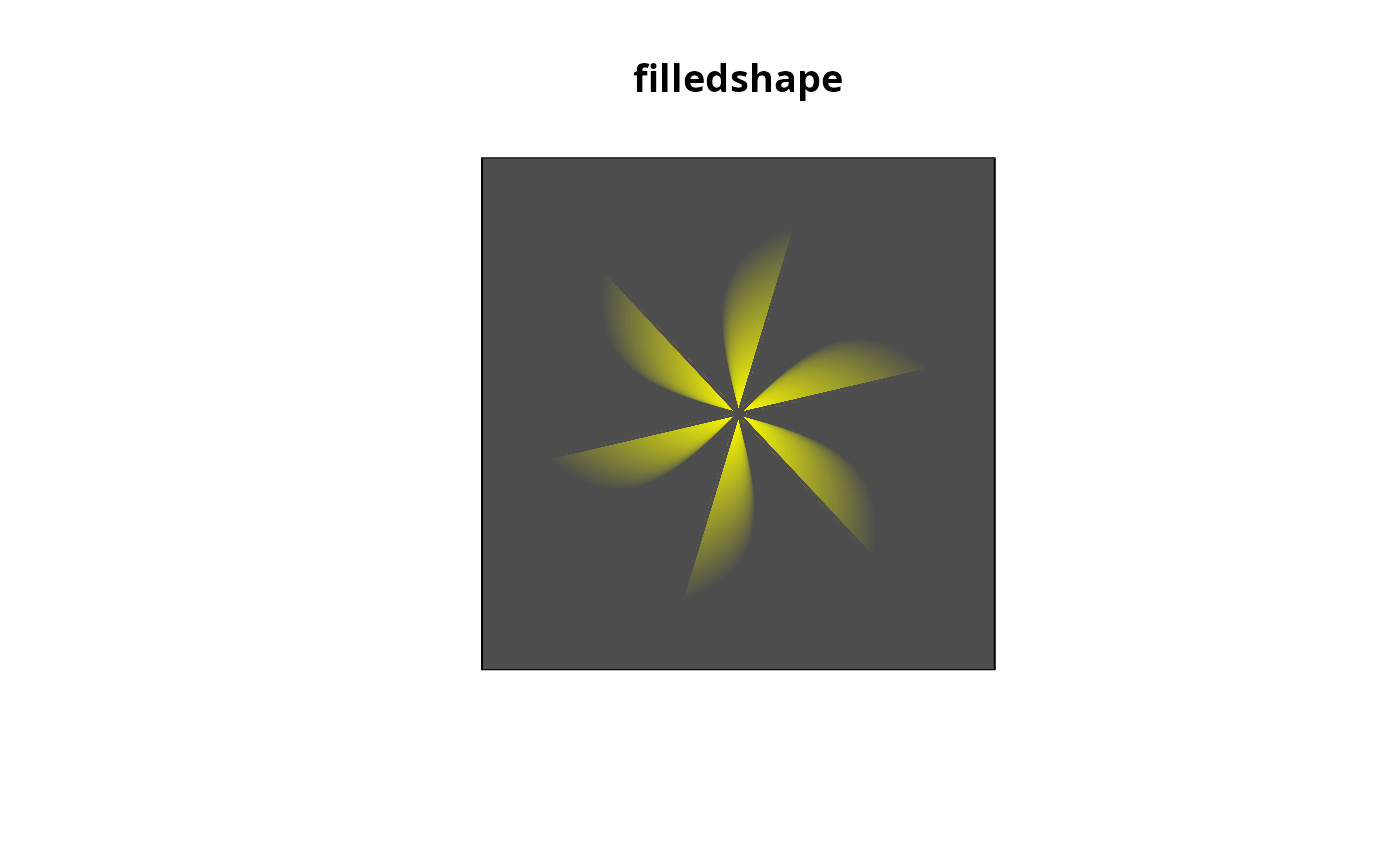
 # a mill
color <- shadepalette(grey(0.3), "yellow", n = 50)
emptyplot(c(-3.3, 3.3), col = color[length(color)], main = "filledshape")
x <- seq(0, 0.8*pi, pi/100)
y <- sin(x)
xouter <- cbind(x, y)
for (i in seq(0, 360, 60))
xouter <- rbind(xouter, rotatexy(cbind(x, y), mid = c(0, 0), angle = i))
filledshape(xouter, c(0, 0), col = color)
# a mill
color <- shadepalette(grey(0.3), "yellow", n = 50)
emptyplot(c(-3.3, 3.3), col = color[length(color)], main = "filledshape")
x <- seq(0, 0.8*pi, pi/100)
y <- sin(x)
xouter <- cbind(x, y)
for (i in seq(0, 360, 60))
xouter <- rbind(xouter, rotatexy(cbind(x, y), mid = c(0, 0), angle = i))
filledshape(xouter, c(0, 0), col = color)
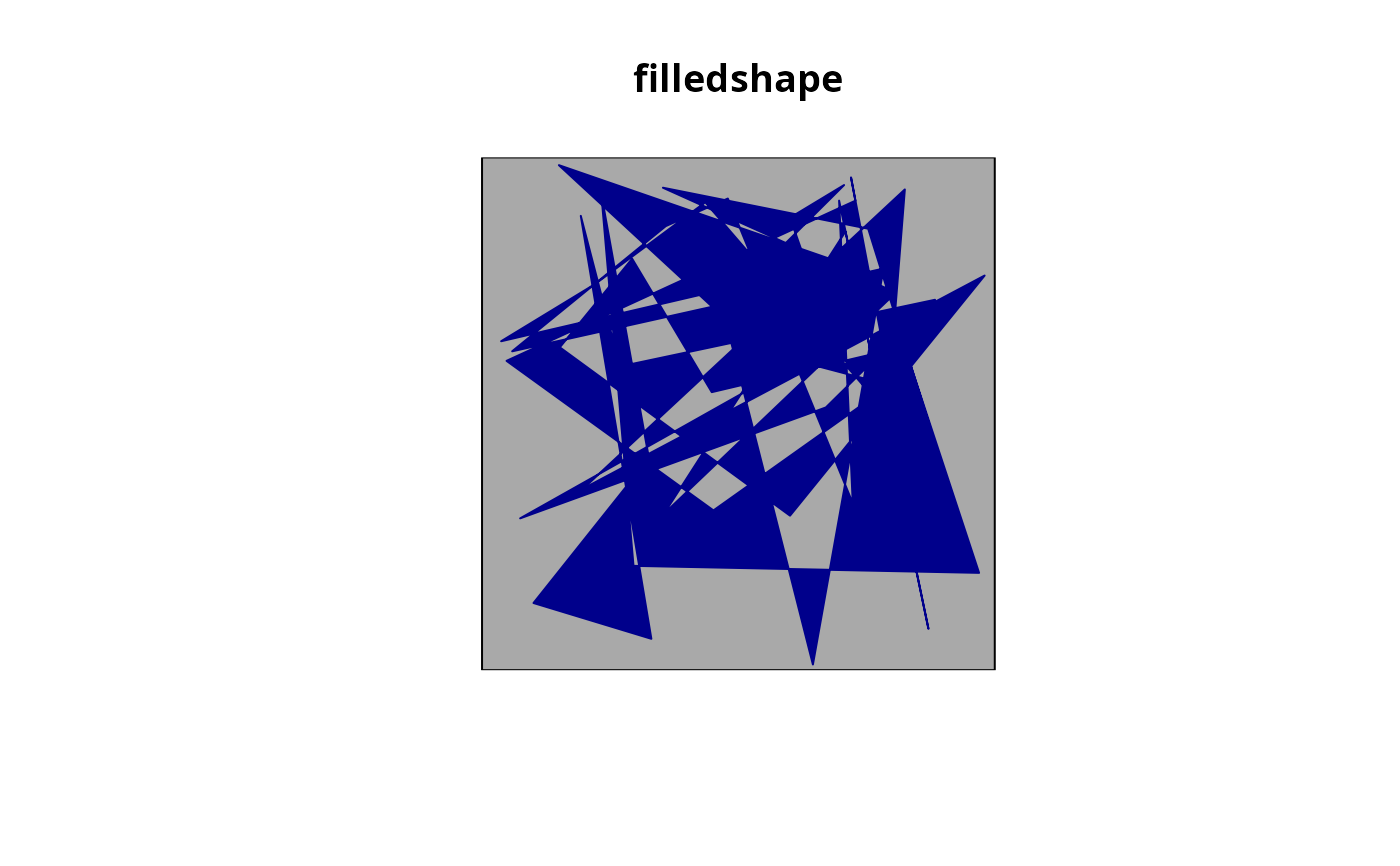
 # abstract art
emptyplot(col = "darkgrey", main = "filledshape")
filledshape(matrix(ncol = 2, runif(100)), col = "darkblue")
# abstract art
emptyplot(col = "darkgrey", main = "filledshape")
filledshape(matrix(ncol = 2, runif(100)), col = "darkblue")