Default Panel Function for cloud
panel.cloud.RdDefault panel functions controlling cloud and
wireframe displays.
Usage
panel.cloud(x, y, subscripts, z,
            groups = NULL,
            perspective = TRUE,
            distance = if (perspective) 0.2 else 0,
            xlim, ylim, zlim,
            panel.3d.cloud = "panel.3dscatter",
            panel.3d.wireframe = "panel.3dwire",
            screen = list(z = 40, x = -60),
            R.mat = diag(4), aspect = c(1, 1),
            par.box = NULL,
            xlab, ylab, zlab,
            xlab.default, ylab.default, zlab.default,
            scales.3d,
            proportion = 0.6,
            wireframe = FALSE,
            scpos,
            ...,
            at,
            identifier = "cloud")
panel.wireframe(...)
panel.3dscatter(x, y, z, rot.mat, distance,
                groups, type = "p",
                xlim, ylim, zlim,
                xlim.scaled, ylim.scaled, zlim.scaled,
                zero.scaled,
                col, col.point, col.line,
                lty, lwd, cex, pch, fill,
                cross, ..., .scale = FALSE, subscripts,
                identifier = "3dscatter")
panel.3dwire(x, y, z, rot.mat = diag(4), distance,
             shade = FALSE,
             shade.colors.palette = trellis.par.get("shade.colors")$palette,
             light.source = c(0, 0, 1000),
             xlim, ylim, zlim,
             xlim.scaled,
             ylim.scaled,
             zlim.scaled,
             col = if (shade) "transparent" else "black",
             lty = 1, lwd = 1,
             alpha,
             col.groups = superpose.polygon$col,
             polynum = 100,
             ...,
             .scale = FALSE,
             drape = FALSE,
             at,
             col.regions = regions$col,
             alpha.regions = regions$alpha,
             identifier = "3dwire")
makeShadePalette(col.regions, ..., min = 0.05, pref = 0.75)
Arguments
- x, y, z
numeric (or possibly factors) vectors representing the data to be displayed. The interpretation depends on the context. For
panel.cloudthese are essentially the same as the data passed to the high level plot (except ifformulawas a matrix, the appropriatexandyvectors are generated). By the time they are passed topanel.3dscatterandpanel.3dwire, they have been appropriately subsetted (usingsubscripts) and scaled (to lie inside a bounding box, usually the [-0.5, 0.5] cube).Further, for
panel.3dwire,xandyare shorter thanzand represent the sorted locations defining a rectangular grid. Also in this case,zmay be a matrix if the display is grouped, with each column representing one surface.In
panel.cloud(called fromwireframe) andpanel.3dwire,x,yandzcould also be matrices (of the same dimension) when they represent a 3-D surface parametrized on a 2-D grid.- subscripts
index specifying which points to draw. The same
x,yandzvalues (representing the whole data) are passed topanel.cloudfor each panel.subscriptsspecifies the subset of rows to be used for the particular panel.- groups
specification of a grouping variable, passed down from the high level functions.
- perspective
logical, whether to plot a perspective view. Setting this to
FALSEis equivalent to settingdistanceto 0- distance
numeric, between 0 and 1, controls amount of perspective. The distance of the viewing point from the origin (in the transformed coordinate system) is
1 / distance. This is described in a little more detail in the documentation forcloud- screen
A list determining the sequence of rotations to be applied to the data before being plotted. The initial position starts with the viewing point along the positive z-axis, and the x and y axes in the usual position. Each component of the list should be named one of
"x","y"or"z"(repetitions are allowed), with their values indicating the amount of rotation about that axis in degrees.- R.mat
initial rotation matrix in homogeneous coordinates, to be applied to the data before
screenrotates the view further.- par.box
graphical parameters for box, namely, col, lty and lwd. By default obtained from the parameter
box.3d.- xlim, ylim, zlim
limits for the respective axes. As with other lattice functions, these could each be a numeric 2-vector or a character vector indicating levels of a factor.
- panel.3d.cloud, panel.3d.wireframe
functions that draw the data-driven part of the plot (as opposed to the bounding box and scales) in
cloudandwireframe. This function is called after the ‘back’ of the bounding box is drawn, but before the ‘front’ is drawn.Any user-defined custom display would probably want to change these functions. The intention is to pass as much information to this function as might be useful (not all of which are used by the defaults). In particular, these functions can expect arguments called
xlim,ylim,zlimwhich give the bounding box ranges in the original data scale andxlim.scaled,ylim.scaled,zlim.scaledwhich give the bounding box ranges in the transformed scale. More arguments can be considered on request.- aspect
aspect as in
cloud- xlab, ylab, zlab
Labels, have to be lists. Typically the user will not manipulate these, but instead control this via arguments to
clouddirectly.- xlab.default
for internal use
- ylab.default
for internal use
- zlab.default
for internal use
- scales.3d
list defining the scales
- proportion
numeric scalar, gives the length of arrows as a proportion of the sides
- scpos
A list with three components x, y and z (each a scalar integer), describing which of the 12 sides of the cube the scales should be drawn. The defaults should be OK. Valid values are x: 1, 3, 9, 11; y: 8, 5, 7, 6 and z: 4, 2, 10, 12. (See comments in the source code of
panel.cloudto see the details of this enumeration.)- wireframe
logical, indicating whether this is a wireframe plot
- drape
logical, whether the facets will be colored by height, in a manner similar to
levelplot. This is ignored ifshade=TRUE.- at
When
drape = TRUEinwireframe, the facets defining the surface are colored as a function of (average) height, similar tolevelplot.atis a numeric vector giving the breakpoints along the z-axis where colors change.- col.regions
vector of colors to be used in conjunction with
atwhendrape = TRUE.In
makeShadePalette, which can be used to define a shading palette (see below),col.regionsis an initial vector defining the base color (as a function of height) that is then adjusted according to irradiance and reflectance.- alpha.regions
numeric scalar controlling transparency when
drape = TRUE.- rot.mat
4x4 transformation matrix in homogeneous coordinates. This gives the rotation matrix combining the
screenandR.matarguments topanel.cloud- type
Character vector, specifying type of cloud plot. Can include one or more of
"p","l","h"or"b"."p"and"l"mean ‘points’ and ‘lines’ respectively, and"b"means ‘both’."h"stands for ‘histogram’, and causes a line to be drawn from each point to the X-Y plane (i.e., the plane representingz = 0), or the lower (or upper) bounding box face, whichever is closer.- xlim.scaled, ylim.scaled, zlim.scaled
axis limits (after being scaled to the bounding box)
- zero.scaled
z-axis location (after being scaled to the bounding box) of the X-Y plane in the original data scale, to which lines will be dropped (if within range) from each point when
type = "h"- cross
logical, defaults to
TRUEifpch = "+".panel.3dscattercan represent each point by a 3d ‘cross’ of sorts (it's much easier to understand looking at an example than from a description). This is different from the usualpchargument, and reflects the depth of the points and the orientation of the axes. This argument indicates whether this feature will be used.This is useful for two reasons. It can be set to
FALSEto use"+"as the plotting character in the regular sense. It can also be used to force this feature in grouped displays.- shade
logical, indicating whether the surface is to be colored using an illumination model with a single light source
- shade.colors.palette
a function (or the name of one) that is supposed to calculate the color of a facet when shading is being used. Three pieces of information are available to the function: first, the cosine of the angle between the incident light ray and the normal to the surface (representing foreshortening); second, the cosine of half the angle between the reflected ray and the viewing direction (useful for non-Lambertian surfaces); and third, the scaled (average) height of that particular facet with respect to the total plot z-axis limits.
All three numbers should be between 0 and 1. The
shade.colors.palettefunction should return a valid color. The default function is obtained from the trellis settings usingmakeShadePalette.- min
numeric, between 0 and 1, giving a minimum saturation in
makeShadePalette- pref
numeric, giving a power that is applied to reflectance value before it is used to ‘darken’ the colors.
- light.source
a 3-vector representing (in cartesian coordinates) the light source. This is relative to the viewing point being (0, 0, 1/distance) (along the positive z-axis), keeping in mind that all observations are bounded within the [-0.5, 0.5] cube
- polynum
quadrilateral faces are drawn in batches of
polynumat a time. Drawing too few at a time increases the total number of calls to the underlyinggrid.polygonfunction, which affects speed. Trying to draw too many at once may be unnecessarily memory intensive. This argument controls the trade-off.- col.groups
colors for different groups
- col, col.point, col.line, lty, lwd, cex, pch, fill, alpha
Graphical parameters. Some other arguments (such as
lexfor line width) may also be passed through the...argument.- ...
other parameters, passed down when appropriate
- .scale
Logical flag, indicating whether
x,y, andzshould be assumed to be in the original data scale and hence scaled before being plotted.x,y, andzare usually already scaled. However, setting.scale=TRUEmay be helpful for calls topanel.3dscatterandpanel.3dwirein user-supplied panel functions.- identifier
A character string that is prepended to the names of grobs that are created by this panel function.
Details
These functions together are responsible for the content drawn inside
each panel in cloud and wireframe.
panel.wireframe is a wrapper to panel.cloud, which does
the actual work.
panel.cloud is responsible for drawing the content that does
not depend on the data, namely, the bounding box, the arrows/scales,
etc. At some point, depending on whether wireframe is TRUE, it
calls either panel.3d.wireframe or panel.3d.cloud, which
draws the data-driven part of the plot.
The arguments accepted by these two functions are different, since
they have essentially different purposes. For cloud, the data is
unstructured, and x, y and z are all passed to
the panel.3d.cloud function. For wireframe, on the other hand,
x and y are increasing vectors with unique values,
defining a rectangular grid. z must be a matrix with
length(x) * length(y) rows, and as many columns as the number
of groups.
panel.3dscatter is the default panel.3d.cloud function.
It has a type argument similar to panel.xyplot,
and supports grouped displays. It tries to honour depth ordering,
i.e., points and lines closer to the camera are drawn later,
overplotting more distant ones. (Of course there is no absolute
ordering for line segments, so an ad hoc ordering is used. There is no
hidden point removal.)
panel.3dwire is the default panel.3d.wireframe
function. It calculates polygons corresponding to the facets one by
one, but waits till it has collected information about polynum
facets, and draws them all at once. This avoids the overhead of
drawing grid.polygon repeatedly, speeding up the rendering
considerably. If shade = TRUE, these attempt to color the
surface as being illuminated from a light source at
light.source. palette.shade is a simple function that
provides the deafult shading colors
Multiple surfaces are drawn if groups is non-null in the call
to wireframe, however, the algorithm is not sophisticated
enough to render intersecting surfaces correctly.
Author
Deepayan Sarkar Deepayan.Sarkar@R-project.org
Examples
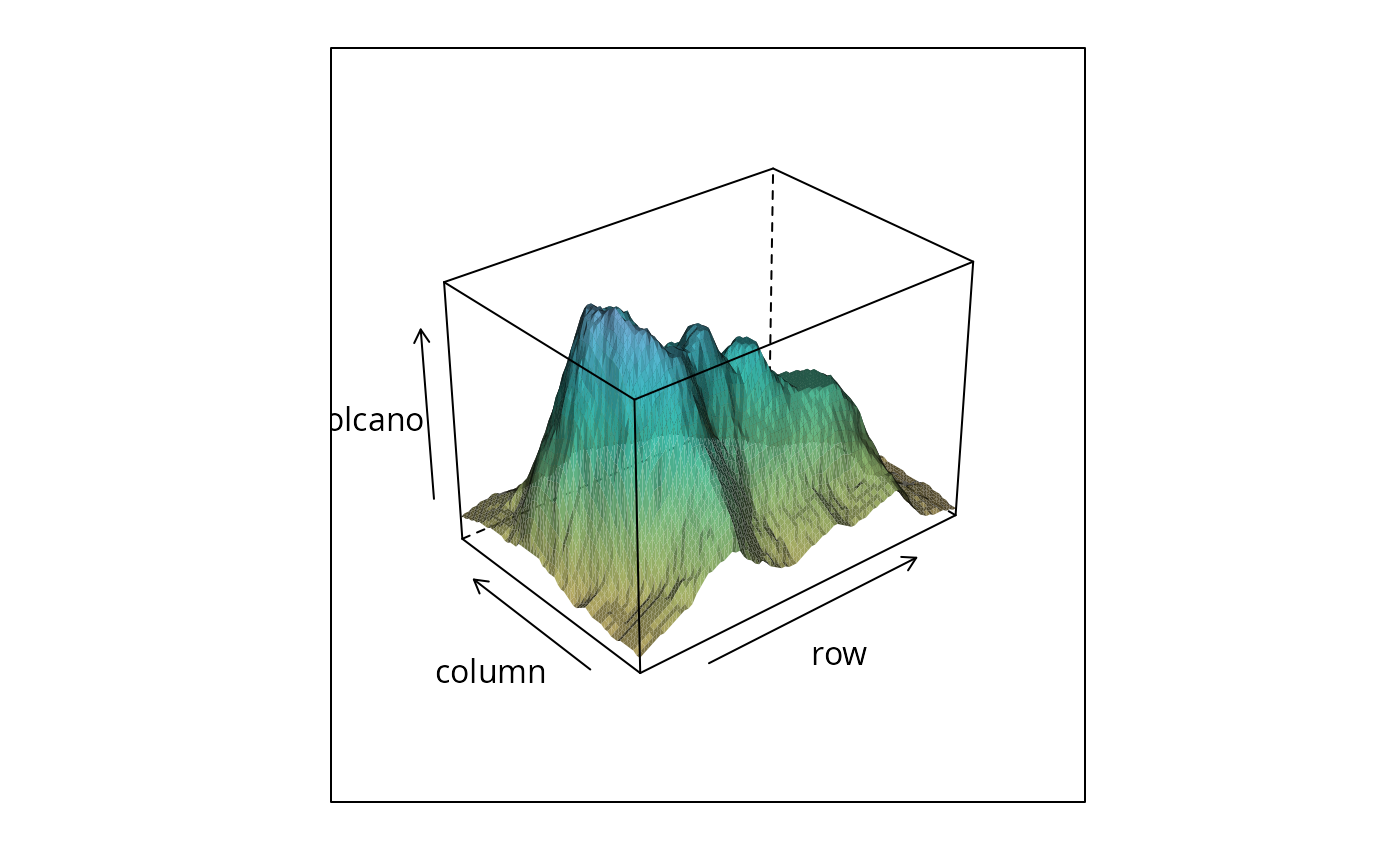
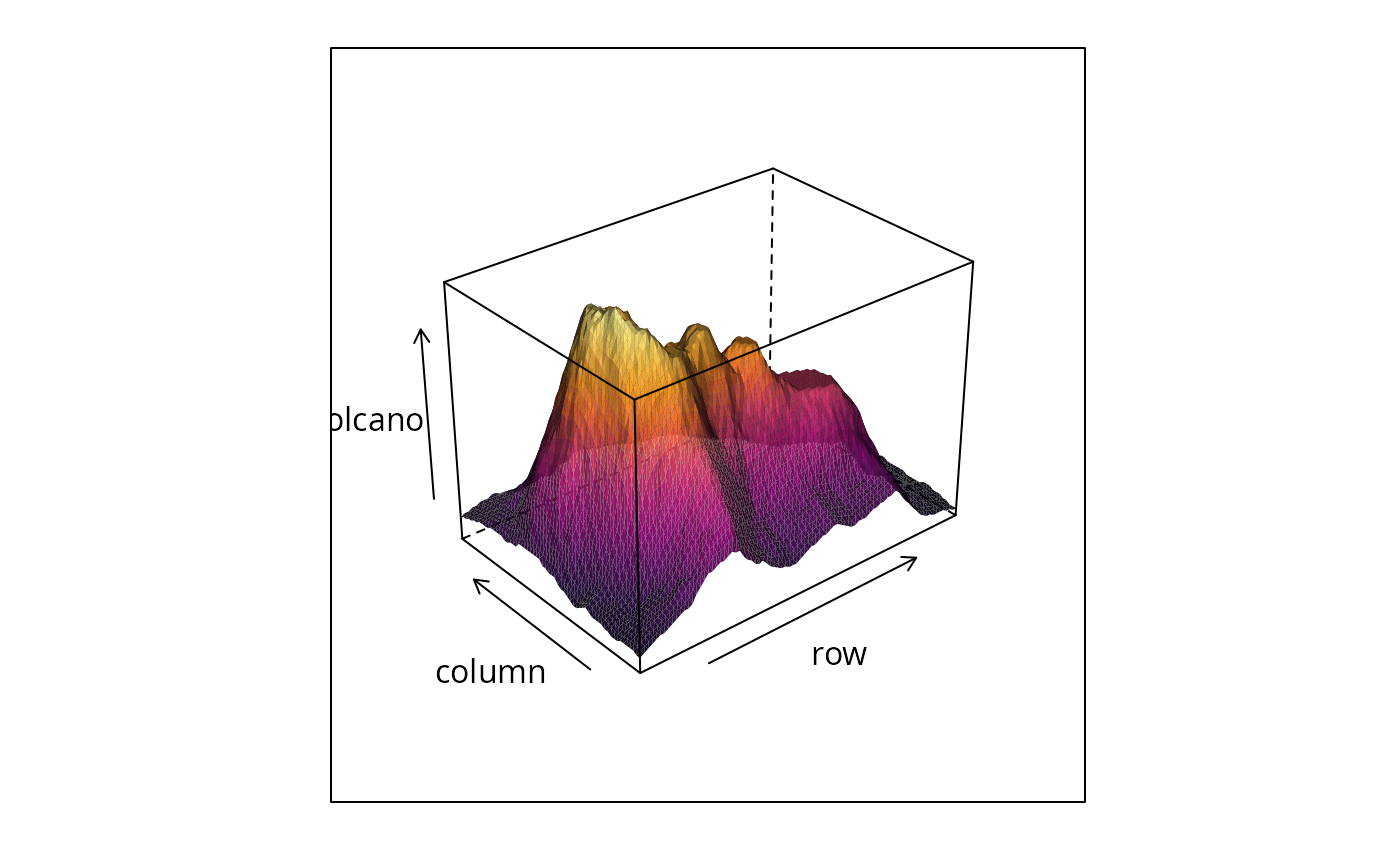
wireframe(volcano, shade = TRUE,
shade.colors.palette = makeShadePalette(hcl.colors(10, "Inferno"),
pref = 0.2))
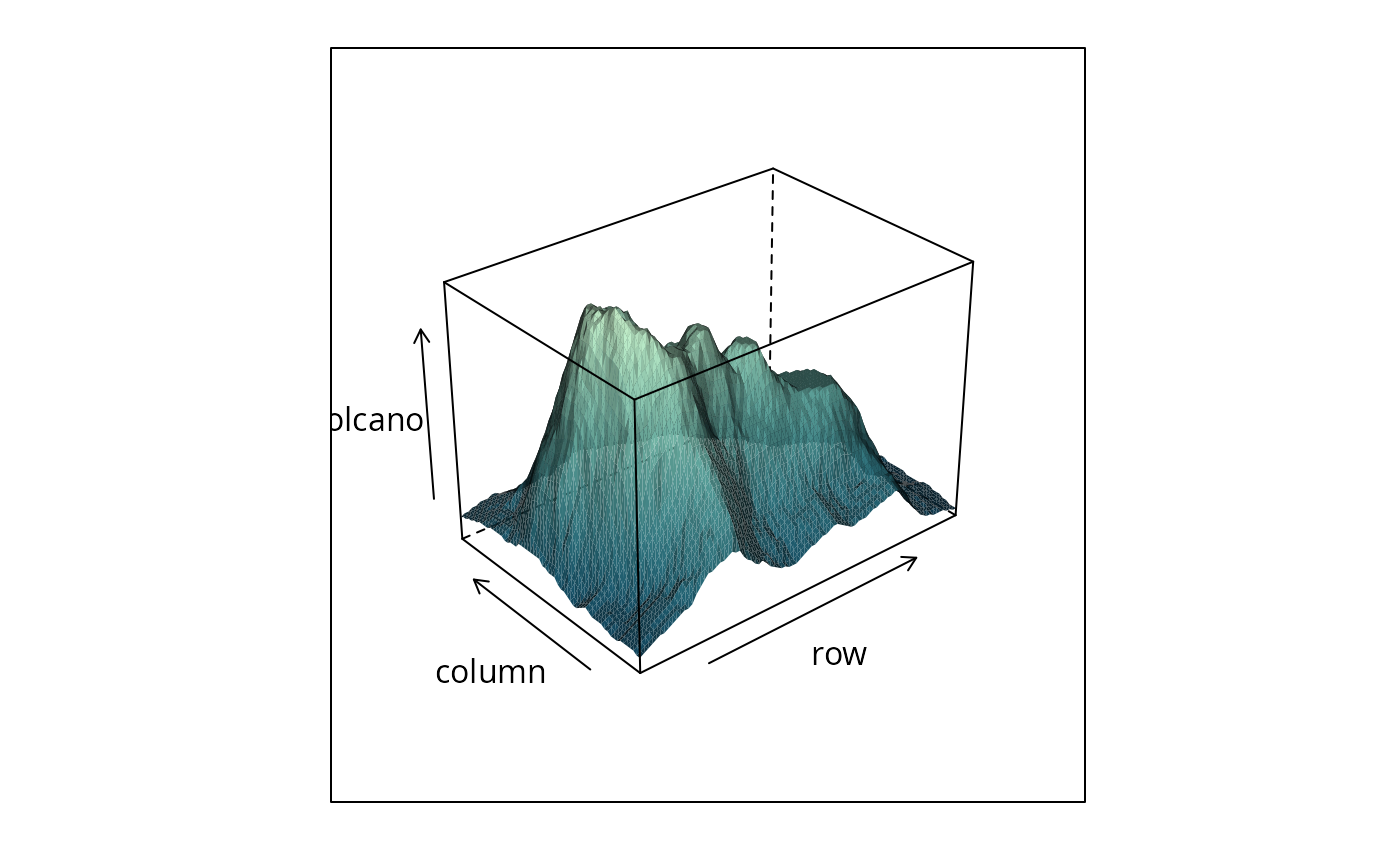
 wireframe(volcano, shade = TRUE,
shade.colors.palette = makeShadePalette(hcl.colors(10, "Dark Mint"),
pref = 0.2))
wireframe(volcano, shade = TRUE,
shade.colors.palette = makeShadePalette(hcl.colors(10, "Dark Mint"),
pref = 0.2))
 wireframe(volcano, shade = TRUE,
shade.colors.palette = makeShadePalette(hcl.colors(10, "Harmonic"),
pref = 0.2))
wireframe(volcano, shade = TRUE,
shade.colors.palette = makeShadePalette(hcl.colors(10, "Harmonic"),
pref = 0.2))