Default Panel Function for xyplot
panel.xyplot.RdThis is the default panel function for xyplot. Also see
panel.superpose. The default panel functions for
splom and qq are essentially the same function.
Usage
panel.xyplot(x, y, type = "p",
             groups = NULL,
             pch, col, col.line, col.symbol,
             font, fontfamily, fontface,
             lty, cex, fill, lwd,
             horizontal = FALSE, ...,
             smooth = NULL,
             grid = lattice.getOption("default.args")$grid,
             abline = NULL,
             jitter.x = FALSE, jitter.y = FALSE,
             factor = 0.5, amount = NULL,
             identifier = "xyplot")
panel.splom(..., identifier = "splom")
panel.qq(..., identifier = "qq")
Arguments
- x,y
variables to be plotted in the scatterplot
- type
character vector controlling how
xandyare to be plotted. Can consist of one or more of the following:"p","l","h","b","o","s","S","g","r","a","smooth", and"spline". Iftypehas more than one element, an attempt is made to combine the effect of each of the components.The behaviour if any of the first five are included in
typeis similar to the effect of the correspondingtypeinplot:"p"and"l"stand for points and lines respectively;"b"and"o"(for ‘overlay’) plot both;"h"draws vertical (or horizontal ifhorizontal = TRUE) line segments from the points to the origin. Types"s"and"S"are like"l"in the sense that they join consecutive points, but instead of being joined by a straight line, points are connected by a vertical and a horizontal segment forming a ‘step’, with the vertical segment coming first for"s", and the horizontal segment coming first for"S". Types"s"and"S"sort the values along one of the axes (depending onhorizontal); this is unlike the behavior inplot. For the latter behavior, usetype = "s"withpanel = panel.points.Type
"g"adds a reference grid usingpanel.gridin the background, but using thegridargument is now the preferred way to do so.The remaining values of
typelead to various types of smoothing. This can also be achieved using thesmoothargument, or by calling the relevant panel functions directly. The panel functions provide finer control over graphical and other parameters, but usingsmoothortypeis convenient for simple usage. Usingsmoothis recommended, buttypeis also supported for backwards compatibility.Type
"r"adds a linear regression line,"smooth"adds a loess fit,"spline"adds a cubic smoothing spline fit, and"a"draws line segments joining the averageyvalue for each distinctxvalue. Seesmoothfor details.See
example(xyplot)anddemo(lattice)for examples.- groups
an optional grouping variable. If present,
panel.superposewill be used instead to display each subgroup- col, col.line, col.symbol
default colours are obtained from
plot.symbolandplot.lineusingtrellis.par.get.- font, fontface, fontfamily
font used when
pchis a character- pch, lty, cex, lwd, fill
other graphical parameters.
fillserves the purpose ofbginpointsfor certain values ofpch- horizontal
A logical flag controlling the orientation for certain
type's, e.g.,"h","s", ans"S"and the result of smoothing.- ...
Extra arguments, if any, for
panel.xyplot. Usually passed on as graphical parameters to low level plotting functions, or to the panel functions performing smoothing, if applicable.- smooth
If specificied, indicates the type of smooth to be added. Can be a character vector containing one or more values from
"lm","loess","spline", and"average". Can also be a logical flag;TRUEis interpreted as"loess". Each of these result in calling a corresponding panel function as described below; thesmoothargument simply provides a convenient shortcut."lm"adds a linear regression line (same aspanel.lmline, except for default graphical parameters)."loess"adds a loess fit (same aspanel.loess)."spline"adds a cubic smoothing spline fit (same aspanel.spline)."average"has the effect of callingpanel.average, which in conjunction with agroupsargument can be useful for creating interaction plots.Normally, smoothing is performed with the
yvariable as the response and thexvariable as the predictor. However, the roles ofxandyare reversed ifhorizontal = TRUE.- grid
A logical flag, character string, or list specifying whether and how a background grid should be drawn. This provides the same functionality as
type="g", but is the preferred alternative as the effecttype="g"is conceptually different from that of othertypevalues (which are all data-dependent). Using thegridargument also allows more flexibility.Most generally,
gridcan be a list of arguments to be supplied topanel.grid, which is called with those arguments. Three shortcuts are available:TRUE:roughly equivalent to
list(h = -1, v = -1)"h":roughly equivalent to
list(h = -1, v = 0)"v":roughly equivalent to
list(h = 0, v = -1)
No grid is drawn if
grid = FALSE.- abline
A numeric vector or more generally a list containing arguments that are used to call
panel.abline. If specified as a numeric vector,ablineis used as the first unnamed argument topanel.abline. This allows arguments of the formabline = c(0, 1), which adds the diagonal line, orabline = coef(fm)to fit the regression line from a fitted mode. Use the list form for finer control; e.g.,abline = list(h = 0, v = 0, col = "grey").For more flexibility, use
panel.ablinedirectly.- jitter.x, jitter.y
logical, whether the data should be jittered before being plotted.
- factor, amount
controls amount of jittering.
- identifier
A character string that is prepended to the names of grobs that are created by this panel function.
Details
Creates scatterplot of x and y, with various
modifications possible via the type argument. panel.qq draws a
45 degree line before calling panel.xyplot.
Note that most of the arguments controlling the display can be
supplied directly to the high-level (e.g. xyplot) call.
Author
Deepayan Sarkar Deepayan.Sarkar@R-project.org
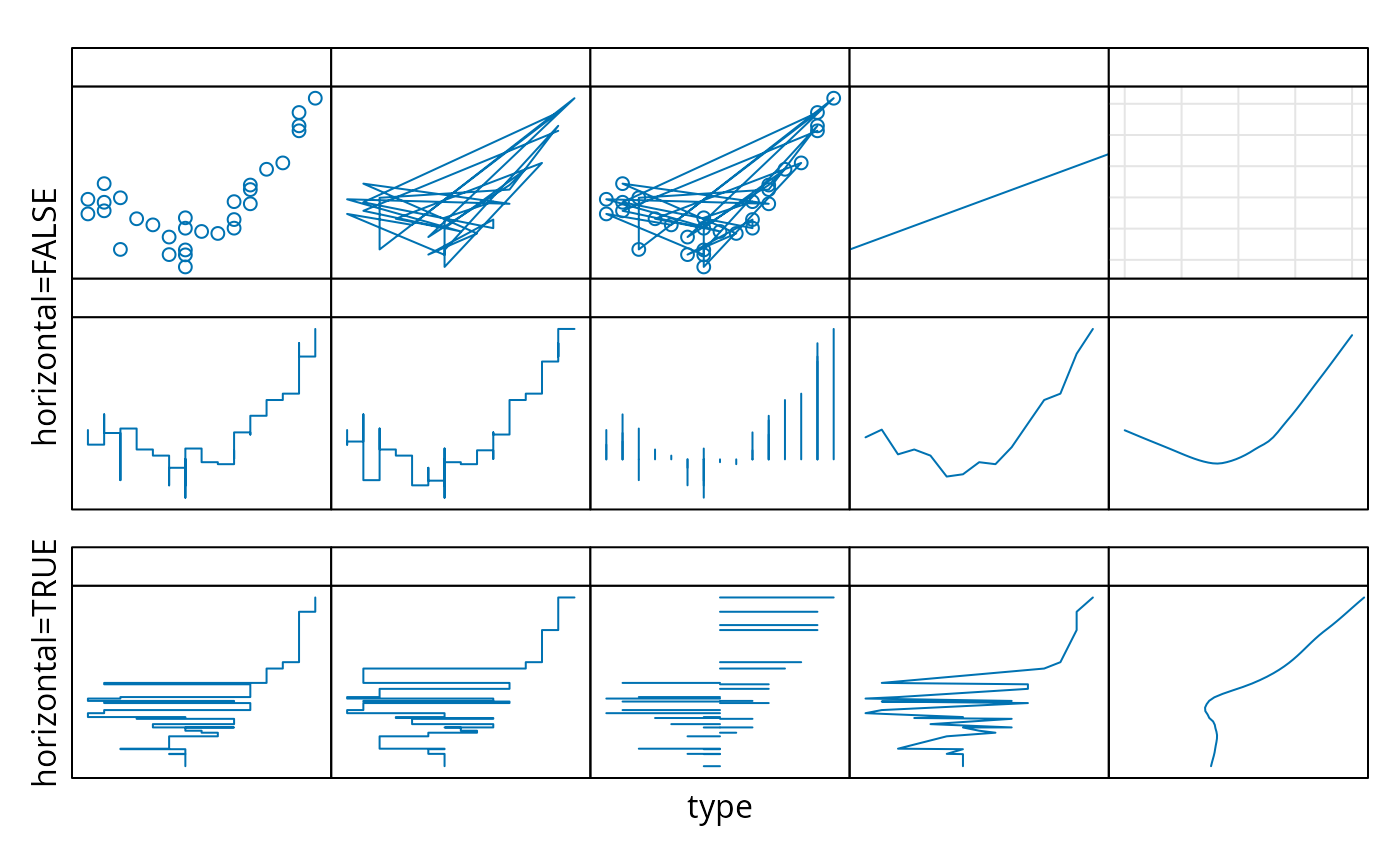
Examples
types.plain <- c("p", "l", "o", "r", "g", "s", "S", "h", "a", "smooth")
types.horiz <- c("s", "S", "h", "a", "smooth")
horiz <- rep(c(FALSE, TRUE), c(length(types.plain), length(types.horiz)))

types <- c(types.plain, types.horiz)

x <- sample(seq(-10, 10, length.out = 15), 30, TRUE)
y <- x + 0.25 * (x + 1)^2 + rnorm(length(x), sd = 5)

xyplot(y ~ x | gl(1, length(types)),
       xlab = "type",
       ylab = list(c("horizontal=TRUE", "horizontal=FALSE"), y = c(1/6, 4/6)),
       as.table = TRUE, layout = c(5, 3),
       between = list(y = c(0, 1)),
       strip = function(...) {
           panel.fill(trellis.par.get("strip.background")$col[1])
           type <- types[panel.number()]
           grid::grid.text(label = sprintf('"%s"', type),
                           x = 0.5, y = 0.5)
           grid::grid.rect()
       },
       scales = list(alternating = c(0, 2), tck = c(0, 0.7), draw = FALSE),
       par.settings =
       list(layout.widths = list(strip.left = c(1, 0, 0, 0, 0))),
       panel = function(...) {
           type <- types[panel.number()]
           horizontal <- horiz[panel.number()]
           panel.xyplot(...,
                        type = type,
                        horizontal = horizontal)
       })[rep(1, length(types))]