3d Scatter Plot and Wireframe Surface Plot
cloud.RdGeneric functions to draw 3d scatter plots and surfaces. The
"formula" methods do most of the actual work.
Usage
cloud(x, data, ...)
wireframe(x, data, ...)

# S3 method for class 'formula'
cloud(x,
      data,
      allow.multiple = is.null(groups) || outer,
      outer = FALSE,
      auto.key = lattice.getOption("default.args")$auto.key,
      aspect = c(1,1),
      panel.aspect = 1,
      panel = lattice.getOption("panel.cloud"),
      prepanel = NULL,
      scales = list(),
      strip = TRUE,
      groups = NULL,
      xlab,
      ylab,
      zlab,
      xlim = if (is.factor(x)) levels(x) else range(x, finite = TRUE),
      ylim = if (is.factor(y)) levels(y) else range(y, finite = TRUE),
      zlim = if (is.factor(z)) levels(z) else range(z, finite = TRUE),
      at,
      drape = FALSE,
      pretty = FALSE,
      drop.unused.levels,
      ...,
      lattice.options = NULL,
      default.scales =
      list(distance = c(1, 1, 1),
           arrows = TRUE,
           axs = axs.default),
      default.prepanel = lattice.getOption("prepanel.default.cloud"),
      colorkey,
      col.regions,
      alpha.regions,
      cuts = 70,
      subset = TRUE,
      axs.default = "r")

# S3 method for class 'data.frame'
cloud(x, data = NULL, formula = data, ...)

# S3 method for class 'formula'
wireframe(x,
          data,
          panel = lattice.getOption("panel.wireframe"),
          default.prepanel = lattice.getOption("prepanel.default.wireframe"),
          ...)

# S3 method for class 'data.frame'
wireframe(x, data = NULL, formula = data, ...)

# S3 method for class 'matrix'
cloud(x, data = NULL, type = "h",
      zlab = deparse(substitute(x)), aspect, ...,
      xlim, ylim, row.values, column.values)

# S3 method for class 'table'
cloud(x, data = NULL, groups = FALSE,
      zlab = deparse(substitute(x)),
      type = "h", ...)

# S3 method for class 'matrix'
wireframe(x, data = NULL,
          zlab = deparse(substitute(x)), aspect, ...,
          xlim, ylim, row.values, column.values)
Arguments
- x
The object on which method dispatch is carried out.
For the
"formula"methods, a formula of the formz ~ x * y | g1 * g2 * ..., wherezis a numeric response, andx,yare numeric values.g1, g2, ..., if present, are conditioning variables used for conditioning, and must be either factors or shingles. In the case ofwireframe, calculations are based on the assumption that thexandyvalues are evaluated on a rectangular grid defined by their unique values. The grid points need not be equally spaced.For
wireframe,x,yandzmay also be matrices (of the same dimension), in which case they are taken to represent a 3-D surface parametrized on a 2-D grid (e.g., a sphere). Conditioning is not possible with this feature. See details below.Missing values are allowed, either as
NAvalues in thezvector, or missing rows in the data frame (note however that in that case the X and Y grids will be determined only by the available values). For a grouped display (producing multiple surfaces), missing rows are not allowed, butNA-s inzare.Both
wireframeandcloudhave methods formatrixobjects, in which casexprovides thezvector described above, while its rows and columns are interpreted as thexandyvectors respectively. This is similar to the form used inpersp.- data
For the
"formula"methods, an optional data frame in which variables in the formula (as well asgroupsandsubset, if any) are to be evaluated.datashould not be specified except when using the"formula"method.- formula
The formula to be used for the
"data.frame"methods. See documentation for argumentxfor details.- row.values, column.values
Optional vectors of values that define the grid when
xis a matrix.row.valuesandcolumn.valuesmust have the same lengths asnrow(x)andncol(x)respectively. By default, row and column numbers.- allow.multiple, outer, auto.key, prepanel, strip, groups, xlab, xlim, ylab, ylim, drop.unused.levels, lattice.options, default.scales, subset
These arguments are documented in the help page for
xyplot. For thecloud.tablemethod,groupsmust be a logical indicating whether the last dimension should be used as a grouping variable as opposed to a conditioning variable. This is only relevant if the table has more than 2 dimensions.- type
type of display in
cloud(seepanel.3dscatterfor details). Defaults to"h"for thematrixmethod.- aspect, panel.aspect
Unlike other high level functions,
aspectis taken to be a numeric vector of length 2, giving the relative aspects of the y-size/x-size and z-size/x-size of the enclosing cube. The usual role of theaspectargument in determining the aspect ratio of the panel (seexyplotfor details) is played bypanel.aspect, except that it can only be a numeric value.For the
matrixmethods, the default y/x aspect isncol(x) / nrow(x)and the z/x aspect is the smaller of the y/x aspect and 1.- panel
panel function used to create the display. See
panel.cloudfor (non-trivial) details.- default.prepanel
Fallback prepanel function. See
xyplot.- scales
a list describing the scales. As with other high level functions (see
xyplotfor details), this list can contain parameters in name=value form. It can also contain components with the special namesx,yandz, which can be similar lists with axis-specific values overriding the ones specified inscales.The most common use for this argument is to set
arrows=FALSE, which causes tick marks and labels to be used instead of arrows being drawn (the default). Both can be suppressed bydraw=FALSE. Another special component isdistance, which specifies the relative distance of the axis label from the bounding box. If specified as a component ofscales(as opposed to one ofscales$zetc), this can be (and is recycled if not) a vector of length 3, specifying distances for the x, y and z labels respectively.Other components that work in the
scalesargument ofxyplotetc. should also work here (as long as they make sense), including explicit specification of tick mark locations and labels. (Not everything is implemented yet, but if you find something that should work but does not, feel free to bug the maintainer.)Note, however, that for these functions
scalescannot contain information that is specific to particular panels. If you really need that, consider using thescales.3dargument ofpanel.cloud.- axs.default
Unlike 2-D display functions,
clouddoes not expand the bounding box to slightly beyound the range of the data, even though it should. This is primarily because this is the natural behaviour inwireframe, which uses the same code.axs.defaultis intended to provide a different default forcloud. However, this feature has not yet been implemented.- zlab
Specifies a label describing the z variable in ways similar to
xlabandylab(i.e. “grob”, character string, expression or list) in other high level functions. Additionally, ifzlab(andxlabandylab) is a list, it can contain a component calledrot, controlling the rotation for the label- zlim
limits for the z-axis. Similar to
xlimandylimin other high level functions- drape
logical, whether the wireframe is to be draped in color. If
TRUE, the height of a facet is used to determine its color in a manner similar to the coloring scheme used inlevelplot. Otherwise, the background color is used to color the facets. This argument is ignored ifshade = TRUE(seepanel.3dwire).- at, col.regions, alpha.regions
these arguments are analogous to those in
levelplot. ifdrape=TRUE,atgives the vector of cutpoints where the colors change, andcol.regionsthe vector of colors to be used in that case.alpha.regionsdetermines the alpha-transparency on supporting devices. These are passed down to the panel function, and also used in the colorkey if appropriate. The default forcol.regionsandalpha.regionsis derived from the Trellis setting"regions"- cuts
if
atis unspecified, the approximate number of cutpoints ifdrape=TRUE- pretty
whether automatic choice of cutpoints should be prettfied
- colorkey
logical indicating whether a color key should be drawn alongside, or a list describing such a key. See
levelplotfor details.- ...
Any number of other arguments can be specified, and are passed to the panel function. In particular, the arguments
distance,perspective,screenandR.matare very important in determining the 3-D display. The argumentshadecan be useful forwireframecalls, and controls shading of the rendered surface. These arguments are described in detail in the help page forpanel.cloud.Additionally, an argument called
zoommay be specified, which should be a numeric scalar to be interpreted as a scale factor by which the projection is magnified. This can be useful to get the variable names into the plot. This argument is actually only used by the default prepanel function.
Details
These functions produce three dimensional plots in each panel (as long
as the default panel functions are used). The orientation is obtained
as follows: the data are scaled to fall within a bounding box that is
contained in the [-0.5, 0.5] cube (even smaller for non-default values
of aspect). The viewing direction is given by a sequence of
rotations specified by the screen argument, starting from the
positive Z-axis. The viewing point (camera) is located at a distance
of 1/distance from the origin. If perspective=FALSE,
distance is set to 0 (i.e., the viewing point is at an infinite
distance).
cloud draws a 3-D Scatter Plot, while wireframe draws a
3-D surface (usually evaluated on a grid). Multiple surfaces can be
drawn by wireframe using the groups argument (although
this is of limited use because the display is incorrect when the
surfaces intersect). Specifying groups with cloud
results in a panel.superpose-like effect (via
panel.3dscatter).
wireframe can optionally render the surface as being
illuminated by a light source (no shadows though). Details can be
found in the help page for panel.3dwire. Note that
although arguments controlling these are actually arguments for the
panel function, they can be supplied to cloud and
wireframe directly.
For single panel plots, wireframe can also plot parametrized
3-D surfaces (i.e., functions of the form f(u,v) = (x(u,v), y(u,v),
z(u,v)), where values of (u,v) lie on a rectangle. The simplest
example of this sort of surface is a sphere parametrized by latitude
and longitude. This can be achieved by calling wireframe with a
formula x of the form z~x*y, where x, y
and z are all matrices of the same dimension, representing the
values of x(u,v), y(u,v) and z(u,v) evaluated on a discrete
rectangular grid (the actual values of (u,v) are irrelevant).
When this feature is used, the heights used to calculate drape
colors or shading colors are no longer the z values, but the
distances of (x,y,z) from the origin.
Note that this feature does not work with groups,
subscripts, subset, etc. Conditioning variables are also
not supported in this case.
The algorithm for identifying which edges of the bounding box are
‘behind’ the points doesn't work in some extreme
situations. Also, panel.cloud tries to figure out the
optimal location of the arrows and axis labels automatically, but can
fail on occasion (especially when the view is from ‘below’ the
data). This can be manually controlled by the scpos argument in
panel.cloud.
These and all other high level Trellis functions have several other
arguments in common. These are extensively documented only in the
help page for xyplot, which should be consulted to learn
more detailed usage.
Note
There is a known problem with grouped wireframe displays
when the (x, y) coordinates represented in the data do not represent
the full evaluation grid. The problem occurs whether the grouping is
specified through the groups argument or through the formula
interface, and currently causes memory access violations. Depending
on the circumstances, this is manifested either as a meaningless plot
or a crash. To work around the problem, it should be enough to have
a row in the data frame for each grid point, with an NA
response (z) in rows that were previously missing.
References
Sarkar, Deepayan (2008) Lattice: Multivariate Data Visualization with R, Springer. http://lmdvr.r-forge.r-project.org/
Value
An object of class "trellis". The
update method can be used to
update components of the object and the
print method (usually called by
default) will plot it on an appropriate plotting device.
See also
Lattice for an overview of the package, as well as
xyplot, levelplot,
panel.cloud.
For interaction, see panel.identify.cloud.
Author
Deepayan Sarkar Deepayan.Sarkar@R-project.org
Examples
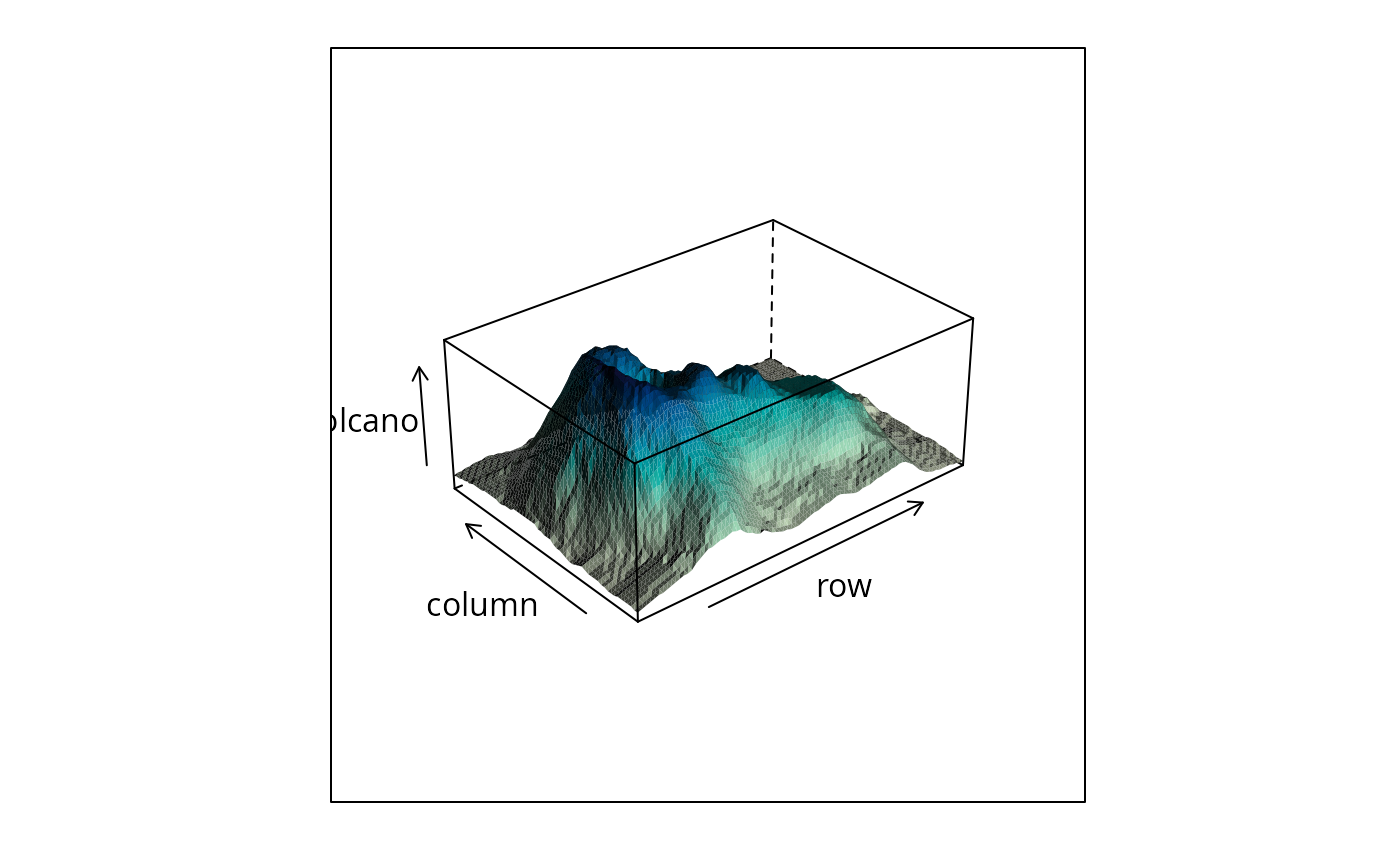
## volcano ## 87 x 61 matrix
wireframe(volcano, shade = TRUE,
aspect = c(61/87, 0.4),
light.source = c(10,0,10))
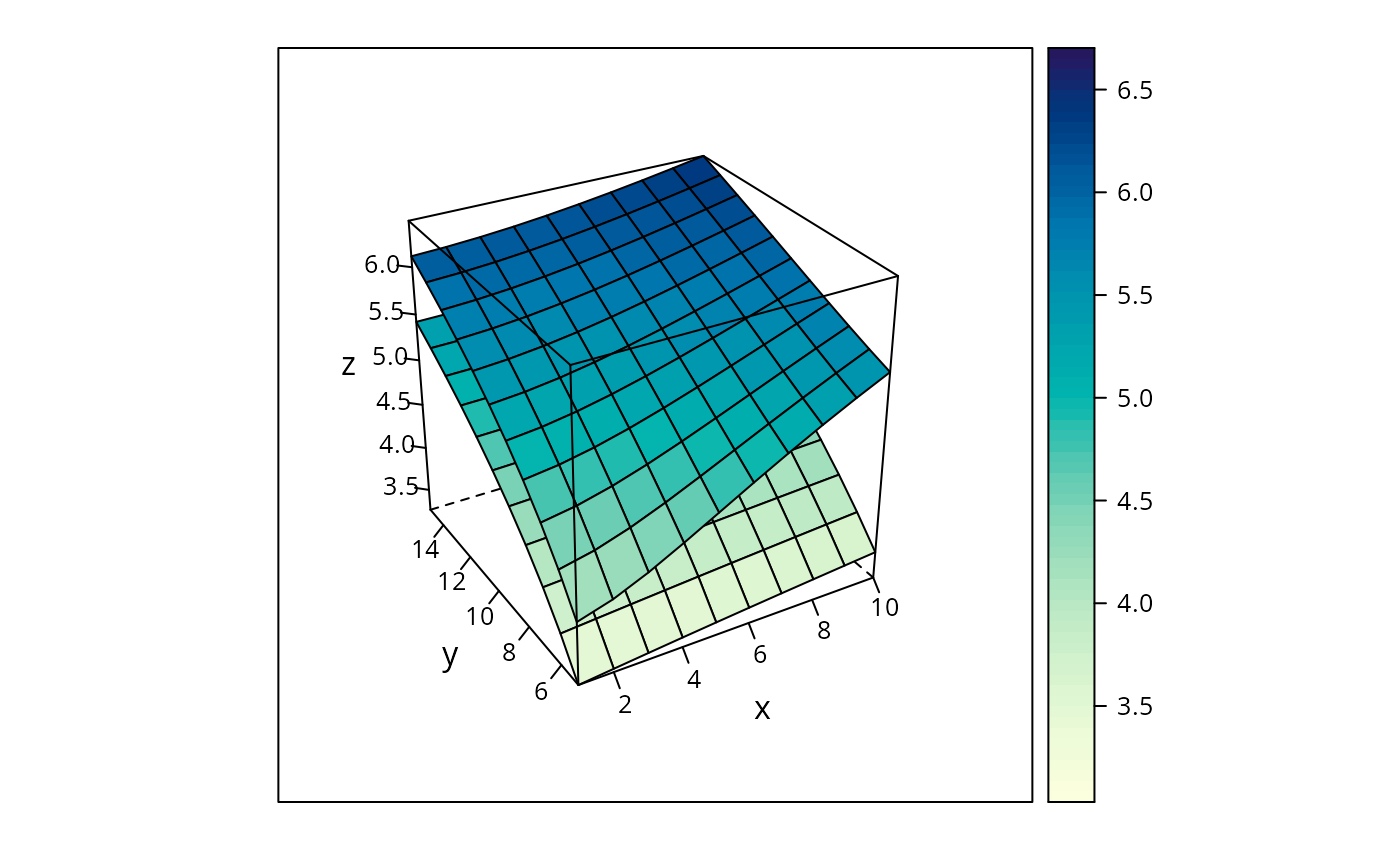
 g <- expand.grid(x = 1:10, y = 5:15, gr = 1:2)
g$z <- log((g$x^g$gr + g$y^2) * g$gr)
wireframe(z ~ x * y, data = g, groups = gr,
scales = list(arrows = FALSE),
drape = TRUE, colorkey = TRUE,
screen = list(z = 30, x = -60))
g <- expand.grid(x = 1:10, y = 5:15, gr = 1:2)
g$z <- log((g$x^g$gr + g$y^2) * g$gr)
wireframe(z ~ x * y, data = g, groups = gr,
scales = list(arrows = FALSE),
drape = TRUE, colorkey = TRUE,
screen = list(z = 30, x = -60))
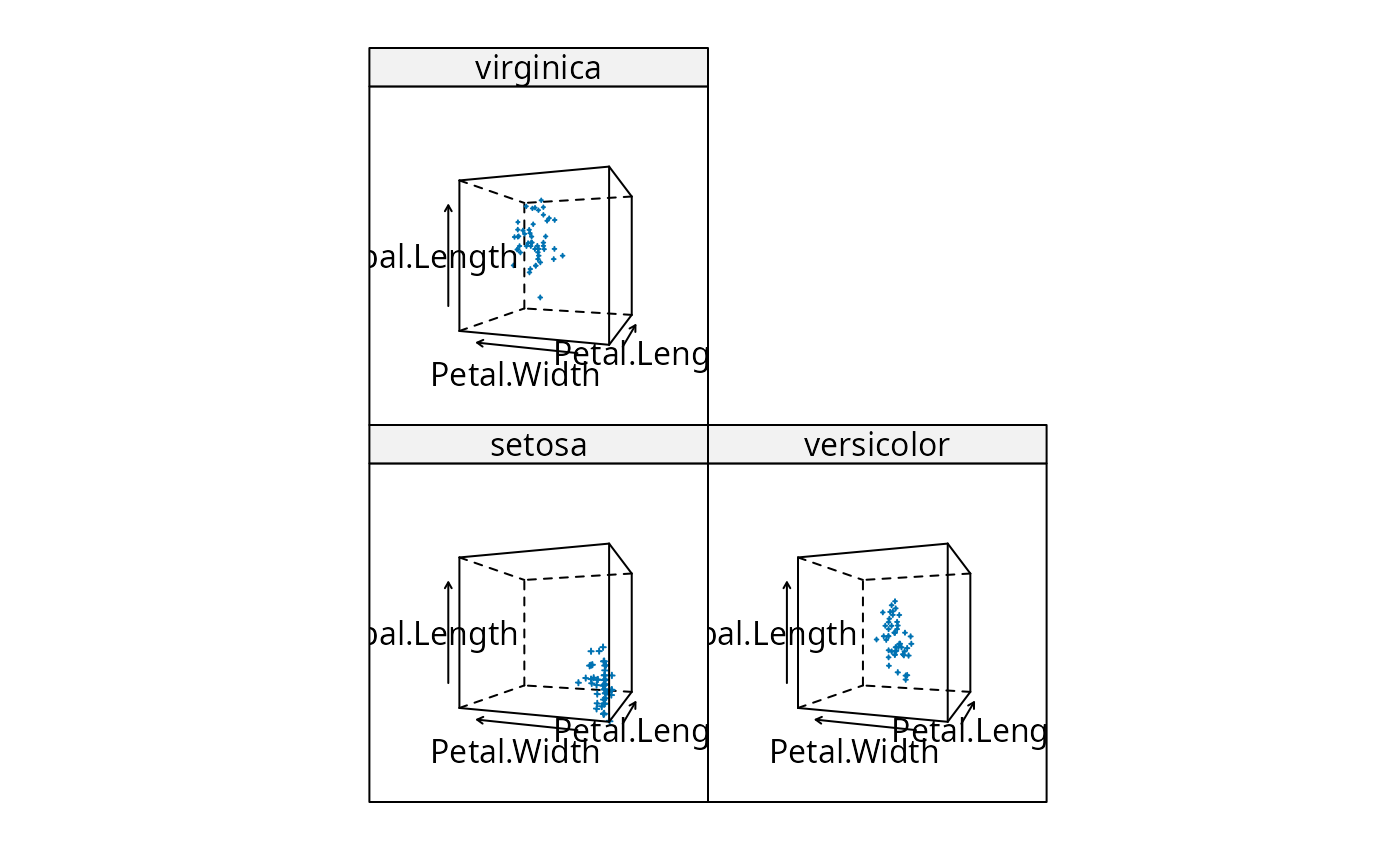
 cloud(Sepal.Length ~ Petal.Length * Petal.Width | Species, data = iris,
screen = list(x = -90, y = 70), distance = .4, zoom = .6)
cloud(Sepal.Length ~ Petal.Length * Petal.Width | Species, data = iris,
screen = list(x = -90, y = 70), distance = .4, zoom = .6)
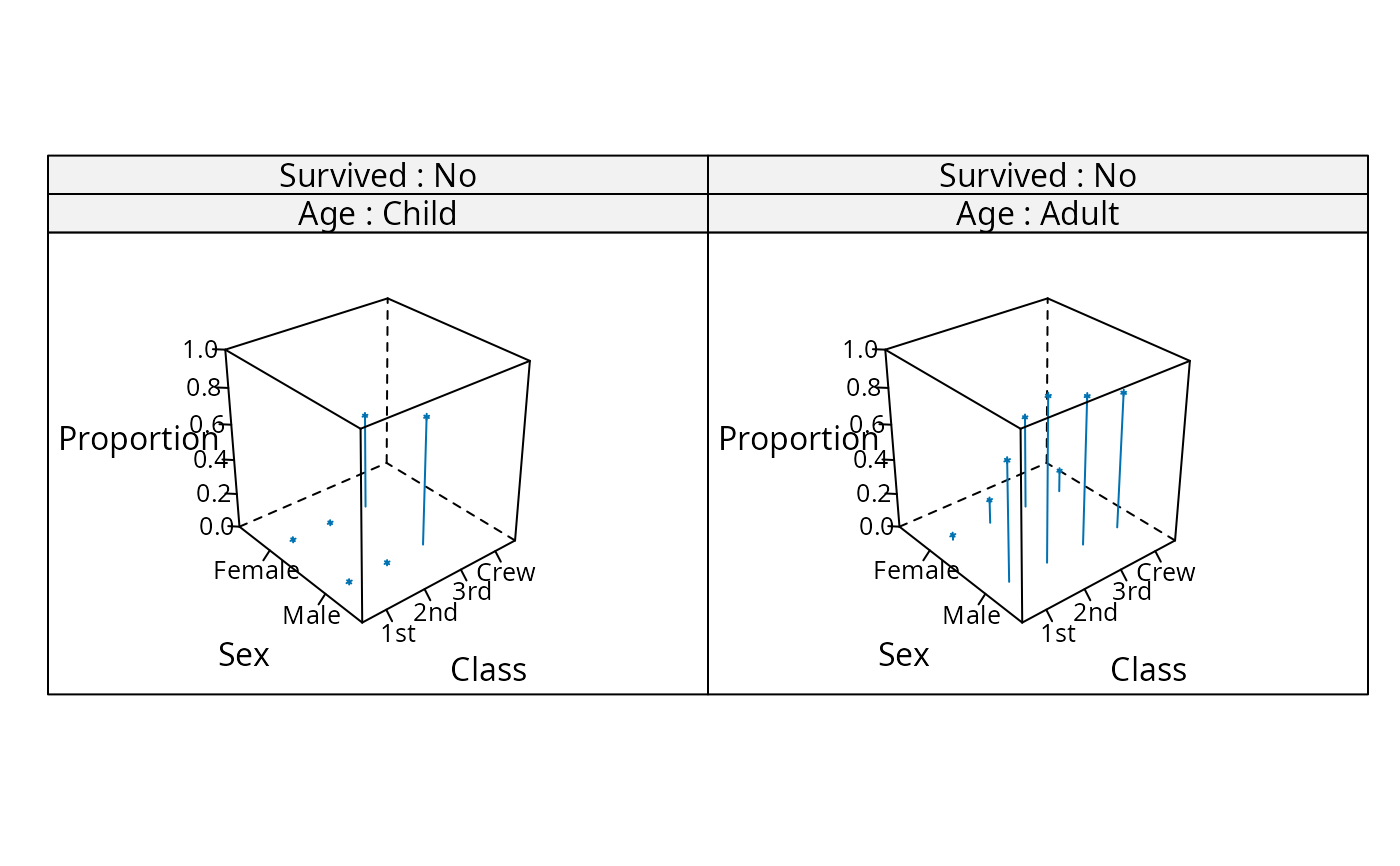
 ## cloud.table
cloud(prop.table(Titanic, margin = 1:3),
type = c("p", "h"), strip = strip.custom(strip.names = TRUE),
scales = list(arrows = FALSE, distance = 2), panel.aspect = 0.7,
zlab = "Proportion")[, 1]
## cloud.table
cloud(prop.table(Titanic, margin = 1:3),
type = c("p", "h"), strip = strip.custom(strip.names = TRUE),
scales = list(arrows = FALSE, distance = 2), panel.aspect = 0.7,
zlab = "Proportion")[, 1]
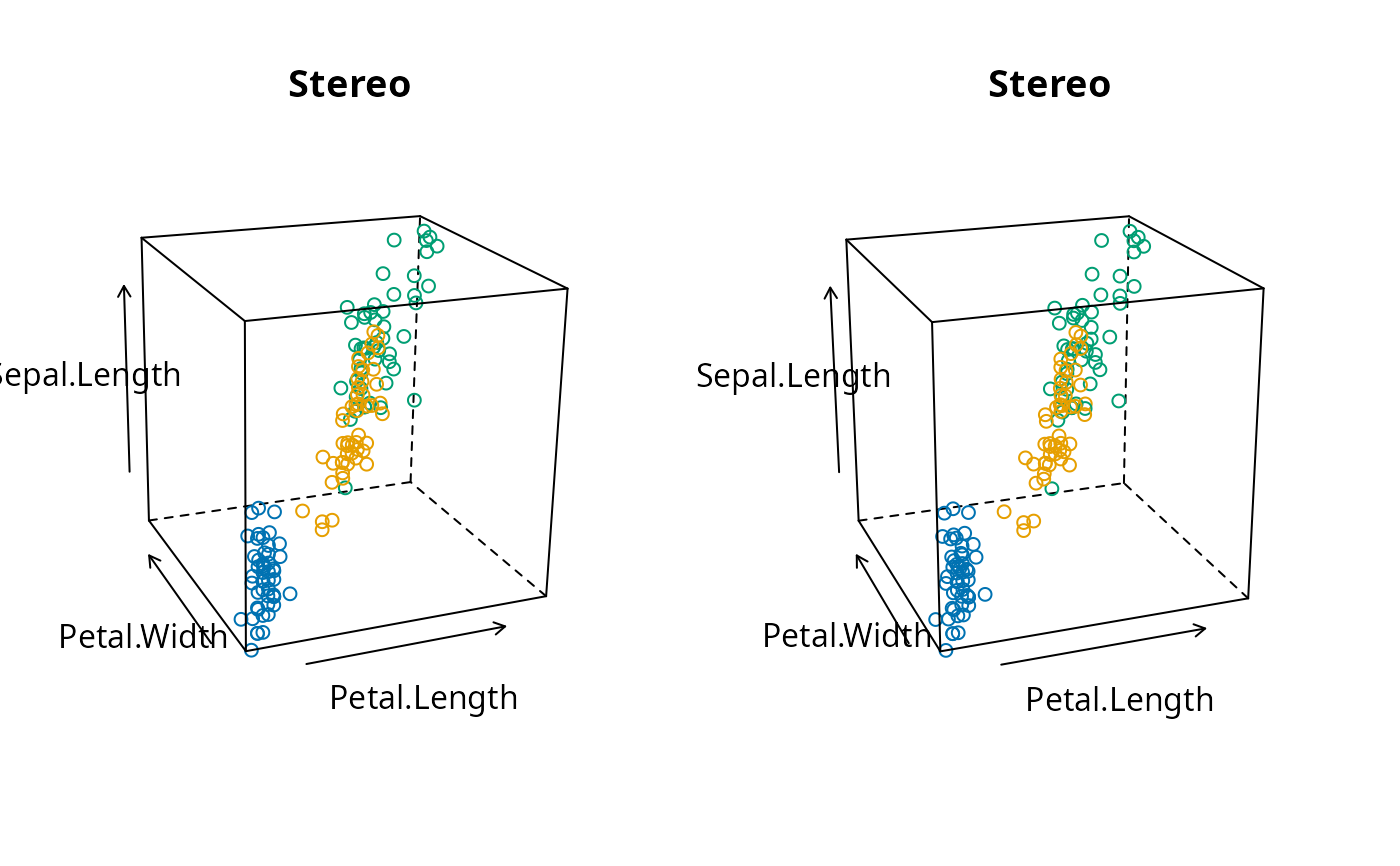
 ## transparent axes
par.set <-
list(axis.line = list(col = "transparent"),
clip = list(panel = "off"))
print(cloud(Sepal.Length ~ Petal.Length * Petal.Width,
data = iris, cex = .8,
groups = Species,
main = "Stereo",
screen = list(z = 20, x = -70, y = 3),
par.settings = par.set,
scales = list(col = "black")),
split = c(1,1,2,1), more = TRUE)
print(cloud(Sepal.Length ~ Petal.Length * Petal.Width,
data = iris, cex = .8,
groups = Species,
main = "Stereo",
screen = list(z = 20, x = -70, y = 0),
par.settings = par.set,
scales = list(col = "black")),
split = c(2,1,2,1))
## transparent axes
par.set <-
list(axis.line = list(col = "transparent"),
clip = list(panel = "off"))
print(cloud(Sepal.Length ~ Petal.Length * Petal.Width,
data = iris, cex = .8,
groups = Species,
main = "Stereo",
screen = list(z = 20, x = -70, y = 3),
par.settings = par.set,
scales = list(col = "black")),
split = c(1,1,2,1), more = TRUE)
print(cloud(Sepal.Length ~ Petal.Length * Petal.Width,
data = iris, cex = .8,
groups = Species,
main = "Stereo",
screen = list(z = 20, x = -70, y = 0),
par.settings = par.set,
scales = list(col = "black")),
split = c(2,1,2,1))