Histograms and Kernel Density Plots
histogram.RdDraw Histograms and Kernel Density Plots, possibly conditioned on other variables.
Usage
histogram(x, data, ...)
densityplot(x, data, ...)

# S3 method for class 'formula'
histogram(x,
          data,
          allow.multiple, outer = TRUE,
          auto.key = lattice.getOption("default.args")$auto.key,
          aspect = "fill",
          panel = lattice.getOption("panel.histogram"),
          prepanel, scales, strip, groups,
          xlab, xlim, ylab, ylim,
          type = c("percent", "count", "density"),
          nint = if (is.factor(x)) nlevels(x)
          else round(log2(length(x)) + 1),
          endpoints = extend.limits(range(as.numeric(x),
                          finite = TRUE), prop = 0.04),
          breaks,
          equal.widths = TRUE,
          drop.unused.levels =
              lattice.getOption("drop.unused.levels"),
          ...,
          lattice.options = NULL,
          default.scales = list(),
          default.prepanel =
              lattice.getOption("prepanel.default.histogram"),
          subscripts,
          subset)

# S3 method for class 'data.frame'
histogram(x, data = NULL, formula = data, ...)

# S3 method for class 'numeric'
histogram(x, data = NULL, xlab, ...)

# S3 method for class 'factor'
histogram(x, data = NULL, xlab, ...)

# S3 method for class 'formula'
densityplot(x,
            data,
            allow.multiple = is.null(groups) || outer,
            outer = !is.null(groups),
            auto.key = lattice.getOption("default.args")$auto.key,
            aspect = "fill",
            panel = lattice.getOption("panel.densityplot"),
            prepanel, scales, strip, groups, weights,
            xlab, xlim, ylab, ylim,
            bw, adjust, kernel, window, width, give.Rkern,
            n = 512, from, to, cut, na.rm,
            drop.unused.levels =
                lattice.getOption("drop.unused.levels"),
            ...,
            lattice.options = NULL,
            default.scales = list(),
            default.prepanel =
                lattice.getOption("prepanel.default.densityplot"),
            subscripts,
            subset)

# S3 method for class 'data.frame'
densityplot(x, data = NULL, formula = data, ...)

# S3 method for class 'numeric'
densityplot(x, data = NULL, xlab, ...)

do.breaks(endpoints, nint)
Arguments
- x
The object on which method dispatch is carried out.
For the
formulamethod,xcan be a formula of the form~ x | g1 * g2 * ..., indicating that histograms or kernel density estimates of thexvariable should be produced conditioned on the levels of the (optional) variablesg1,g2, ....xshould be numeric (or possibly a factor in the case ofhistogram), and each ofg1,g2, ... should be either factors or shingles.As a special case, the right hand side of the formula can contain more than one term separated by ‘+’ signs (e.g.,
~ x1 +
    x2 | g1 * g2
). What happens in this case is described in the documentation forxyplot. Note that in either form, all the terms in the formula must have the same length after evaluation.For the
numericandfactormethods,xis the variable whose histogram or Kernel density estimate is drawn. Conditioning is not allowed in these cases.- data
For the
formulamethod, an optional data source (usually a data frame) in which variables are to be evaluated (seexyplotfor details).datashould not be specified for the other methods, and is ignored with a warning if it is.- formula
The formula to be used for the
"data.frame"methods. See documentation for argumentxfor details.- type
A character string indicating the type of histogram that is to be drawn.
"percent"and"count"give relative frequency and frequency histograms respectively, and can be misleading when breakpoints are not equally spaced."density"produces a density histogram.typedefaults to"density"when the breakpoints are unequally spaced, and whenbreaksisNULLor a function, and to"percent"otherwise.- nint
An integer specifying the number of histogram bins, applicable only when
breaksis unspecified orNULLin the call. Ignored when the variable being plotted is a factor.- endpoints
A numeric vector of length 2 indicating the range of x-values that is to be covered by the histogram. This applies only when
breaksis unspecified and the variable being plotted is not a factor. Indo.breaks, this specifies the interval that is to be divided up.- breaks
Usually a numeric vector of length (number of bins + 1) defining the breakpoints of the bins. Note that when breakpoints are not equally spaced, the only value of
typethat makes sense is density.When
breaksis unspecified, the value oflattice.getOption("histogram.breaks")is first checked. If this value isNULL, then the default is to usewhen
xis a factor, andbreaks = do.breaks(endpoints, nint)otherwise. Breakpoints calculated in such a manner are used in all panels. If the retrieved value is not
NULL, or ifbreaksis explicitly specified, it affects the display in each panel independently. Valid values are those accepted as thebreaksargument inhist. In particular, this allows specification ofbreaksas an integer giving the number of bins (similar tonint), as a character string denoting a method, or as a function.When specified explicitly, a special value of
breaksisNULL, in which case the number of bins is determined bynintand then breakpoints are chosen according to the value ofequal.widths.- equal.widths
A logical flag, relevant only when
breaks=NULL. IfTRUE, equally spaced bins will be selected, otherwise, approximately equal area bins will be selected (typically producing unequally spaced breakpoints).- n
Integer, giving the number of points at which the kernel density is to be evaluated. Passed on as an argument to
density.- panel
A function, called once for each panel, that uses the packet (subset of panel variables) corresponding to the panel to create a display. The default panel functions
panel.histogramandpanel.densityplotare documented separately, and have arguments that can be used to customize its output in various ways. Such arguments can usually be directly supplied to the high-level function.- allow.multiple, outer
See
xyplot.- auto.key
See
xyplot.- aspect
See
xyplot.- prepanel
See
xyplot.- scales
See
xyplot.- strip
See
xyplot.- groups
See
xyplot. Note that the default panel function forhistogramdoes not support grouped displays, whereas the one fordensityplotdoes.- xlab, ylab
See
xyplot.- xlim, ylim
See
xyplot.- drop.unused.levels
See
xyplot.- lattice.options
See
xyplot.- default.scales
See
xyplot.- subscripts
See
xyplot.- subset
See
xyplot.- default.prepanel
Fallback prepanel function. See
xyplot.- weights
numeric vector of weights for the density calculations, evaluated in the non-standard manner used for
groupsand terms in the formula, if any. If this is specified, it is subsetted usingsubscriptsinside the panel function to match it to the correspondingxvalues.At the time of writing,
weightsdo not work in conjunction with an extended formula specification (this is not too hard to fix, so just bug the maintainer if you need this feature).- bw, adjust, width
Arguments controlling bandwidth. Passed on as arguments to
density.- kernel, window
The choice of kernel. Passed on as arguments to
density.- give.Rkern
Logical flag, passed on as argument to
density. This argument is made available only for ease of implementation, and will produce an error ifTRUE.- from, to, cut
Controls range over which density is evaluated. Passed on as arguments to
density.- na.rm
Logical flag specifying whether
NAvalues should be ignored. Passed on as argument todensity, but unlike indensity, the default isTRUE.- ...
Further arguments. See corresponding entry in
xyplotfor non-trivial details.
Value
An object of class "trellis". The
update method can be used to
update components of the object and the
print method (usually called by
default) will plot it on an appropriate plotting device.
Details
histogram draws Conditional Histograms, and densityplot
draws Conditional Kernel Density Plots. The default panel function
uses the density function to compute the density
estimate, and all arguments accepted by density can be
specified in the call to densityplot to control the output.
See documentation of density for details.
These and all other high level Trellis functions have several
arguments in common. These are extensively documented only in the
help page for xyplot, which should be consulted to learn more
detailed usage.
do.breaks is an utility function that calculates breakpoints
given an interval and the number of pieces to break it into.
Note
The form of the arguments accepted by the default panel function
panel.histogram is different from that in S-PLUS. Whereas
S-PLUS calculates the heights inside histogram and passes only
the breakpoints and the heights to the panel function, lattice
simply passes along the original variable x along with the
breakpoints. This approach is more flexible; see the example below
with an estimated density superimposed over the histogram.
References
Sarkar, Deepayan (2008) Lattice: Multivariate Data Visualization with R, Springer. http://lmdvr.r-forge.r-project.org/
Author
Deepayan Sarkar Deepayan.Sarkar@R-project.org
Examples
require(stats)
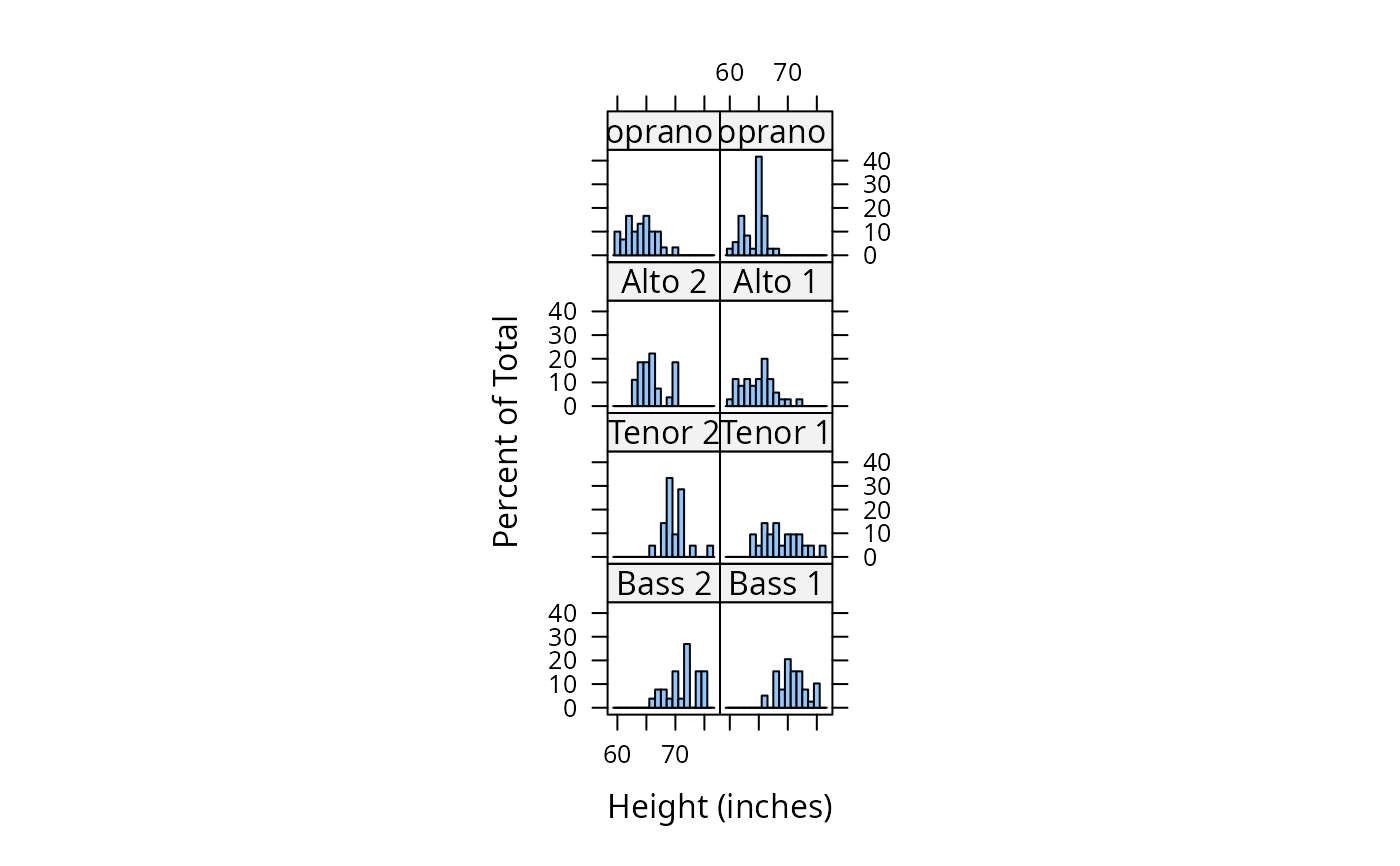
histogram( ~ height | voice.part, data = singer, nint = 17,
endpoints = c(59.5, 76.5), layout = c(2,4), aspect = 1,
xlab = "Height (inches)")
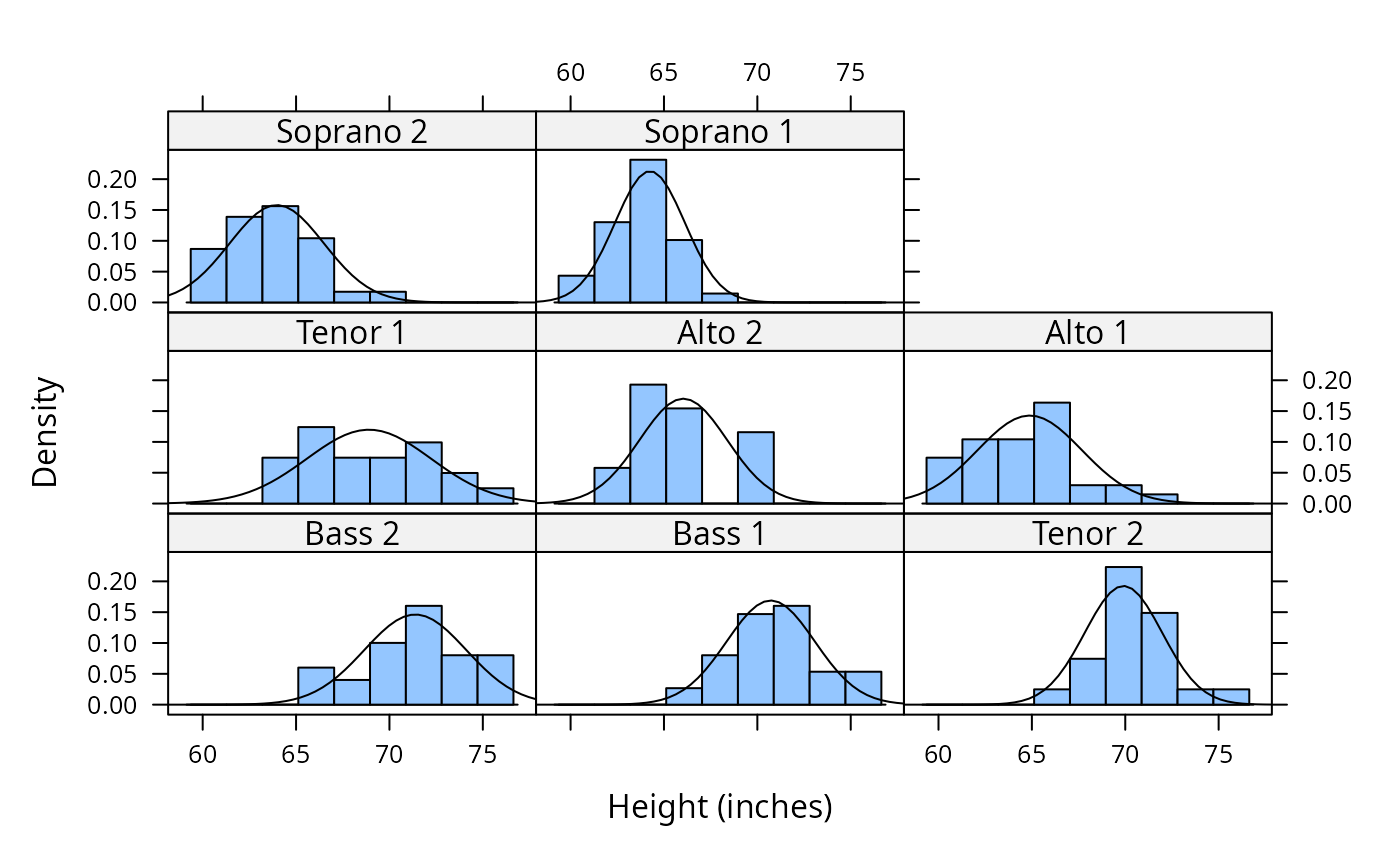
 histogram( ~ height | voice.part, data = singer,
xlab = "Height (inches)", type = "density",
panel = function(x, ...) {
panel.histogram(x, ...)
panel.mathdensity(dmath = dnorm, col = "black",
args = list(mean=mean(x),sd=sd(x)))
} )
histogram( ~ height | voice.part, data = singer,
xlab = "Height (inches)", type = "density",
panel = function(x, ...) {
panel.histogram(x, ...)
panel.mathdensity(dmath = dnorm, col = "black",
args = list(mean=mean(x),sd=sd(x)))
} )
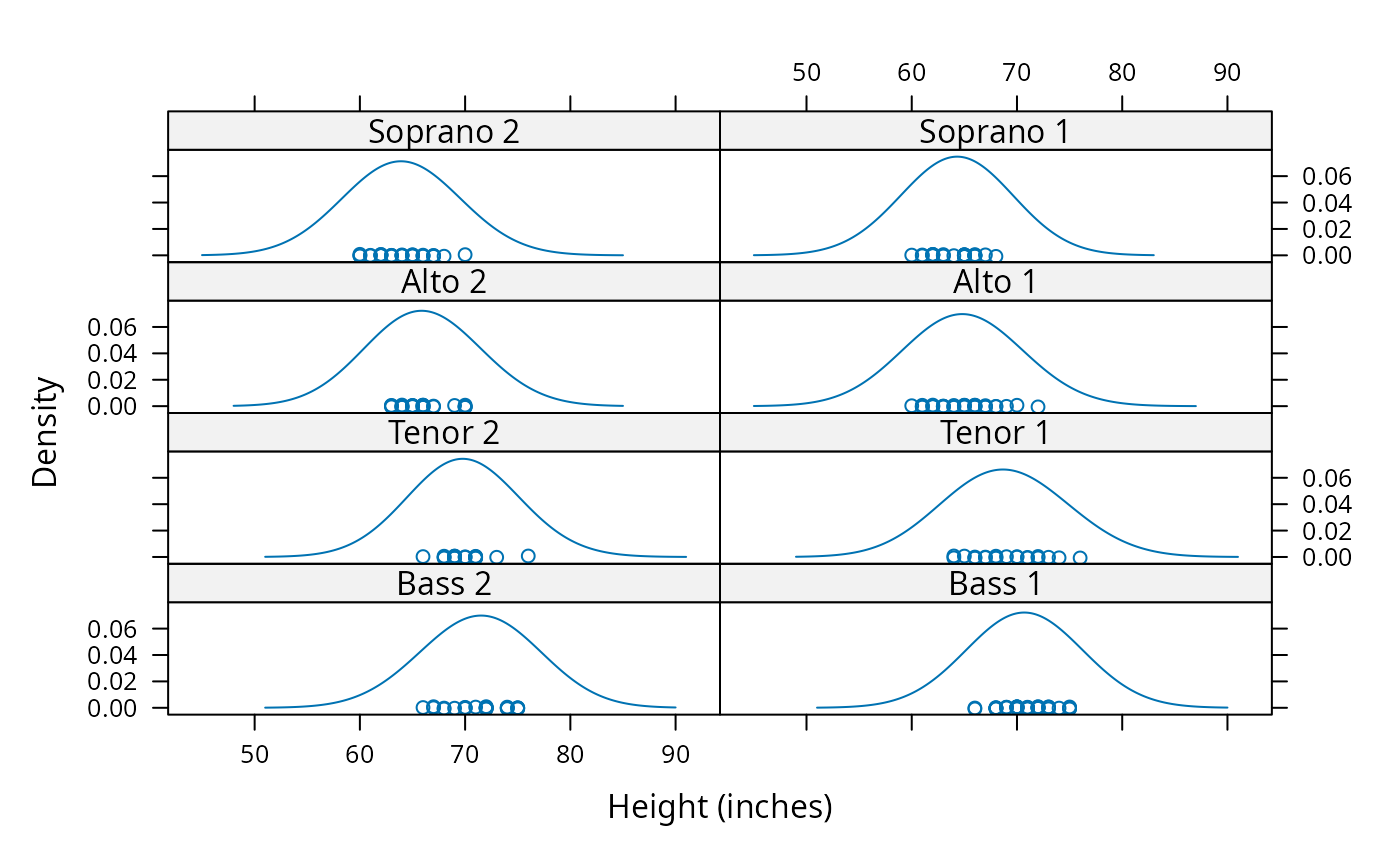
 densityplot( ~ height | voice.part, data = singer, layout = c(2, 4),
xlab = "Height (inches)", bw = 5)
densityplot( ~ height | voice.part, data = singer, layout = c(2, 4),
xlab = "Height (inches)", bw = 5)