Useful Panel Function Components
panel.functions.RdThese are predefined panel functions available in lattice for use in constructing new panel functions (often on-the-fly).
Usage
panel.abline(a = NULL, b = 0,
             h = NULL, v = NULL,
             reg = NULL, coef = NULL,
             col, col.line, lty, lwd, alpha, type,
             ...,
             reference = FALSE,
             identifier = "abline")
panel.refline(...)

panel.curve(expr, from, to, n = 101,
            curve.type = "l",
            col, lty, lwd, type,
            ...,
            identifier = "curve")
panel.rug(x = NULL, y = NULL,
          regular = TRUE,
          start = if (regular) 0 else 0.97,
          end = if (regular) 0.03 else 1,
          x.units = rep("npc", 2),
          y.units = rep("npc", 2),
          col, col.line, lty, lwd, alpha,
          ...,
          identifier = "rug")
panel.average(x, y, fun = mean, horizontal = TRUE,
              lwd, lty, col, col.line, type,
              ...,
              identifier = "linejoin")
panel.linejoin(x, y, fun = mean, horizontal = TRUE,
               lwd, lty, col, col.line, type,
               ...,
               identifier = "linejoin")

<!-- % panel.abline(a, b, \dots) -->
<!-- % panel.abline(coef, \dots) -->
<!-- % panel.abline(reg, \dots) -->
<!-- % panel.abline(h= ,v= , \dots) -->
panel.fill(col, border, ..., identifier = "fill")
panel.grid(h=3, v=3, col, col.line, lty, lwd, x, y, ..., identifier = "grid")
panel.lmline(x, y, ..., identifier = "lmline")
panel.mathdensity(dmath = dnorm, args = list(mean=0, sd=1),
                  n = 50, col, col.line, lwd, lty, type,
                  ..., identifier = "mathdensity")
Arguments
- x, y
Variables defining the contents of the panel. In
panel.gridthese are optional and are used only to choose an appropriate method ofpretty.- a, b
Coefficients of the line to be added by
panel.abline.acan be a vector of length 2, representing the coefficients of the line to be added, in which casebshould be missing.acan also be an appropriate ‘regression’ object, i.e., an object which has acoefmethod that returns a length 2 numeric vector. The corresponding line will be plotted. Theregargument overridesaif specified.- coef
Coefficients of the line to be added as a vector of length 2.
- reg
A (linear) regression object, with a
coefmethod that gives the coefficints of the corresponding regression line.- h, v
For
panel.abline, these are numeric vectors giving locations respectively of horizontal and vertical lines to be added to the plot, in native coordinates.For
panel.grid, these usually specify the number of horizontal and vertical reference lines to be added to the plot. Alternatively, they can be negative numbers.h=-1andv=-1are intended to make the grids aligned with the axis labels. This doesn't always work; all that actually happens is that the locations are chosen usingpretty, which is also how the label positions are chosen in the most common cases (but not for factor variables, for instance).handvcan be negative numbers other than-1, in which case-hand-v(as appropriate) is supplied as thenargument topretty.If
xand/oryare specified inpanel.grid, they will be used to select an appropriate method forpretty. This is particularly useful while plotting date-time objects.- reference
A logical flag determining whether the default graphical parameters for
panel.ablineshould be taken from the “reference.line” parameter settings. The default is to take them from the “add.line” settings. Thepanel.reflinefunction is a wrapper aroundpanel.ablinethat calls it withreference = TRUE.- expr
An expression considered as a function of
x, or a function, to be plotted as a curve.- n
The number of points to use for drawing the curve.
- from, to
optional lower and upper x-limits of curve. If missing, limits of current panel are used
- curve.type
Type of curve (
"p"for points, etc), passed tollines- regular
A logical flag indicating whether the ‘rug’ is to be drawn on the ‘regular’ side (left / bottom) or not (right / top).
- start, end
endpoints of rug segments, in normalized parent coordinates (between 0 and 1). Defaults depend on value of
regular, and cover 3% of the panel width and height.- x.units, y.units
Character vectors, replicated to be of length two. Specifies the (grid) units associated with
startandendabove.x.unitsandy.unitsare for the rug on the x-axis and y-axis respectively (and thus are associated withstartandendvalues on the y and x scales respectively).- col, col.line, lty, lwd, alpha, border
Graphical parameters.
- type
Usually ignored by the panel functions documented here; the argument is present only to make sure an explicitly specified
typeargument (perhaps meant for another function) does not affect the display.- fun
The function that will be applied to the subset of
xvalues (oryifhorizontalisFALSE) determined by the unique values ofy(x).- horizontal
A logical flag. If
FALSE, the plot is ‘transposed’ in the sense that the roles ofxandyare switched;xis now the ‘factor’. Interpretation of other arguments change accordingly. See documentation ofbwplotfor a fuller explanation.- dmath
A vectorized function that produces density values given a numeric vector named
x, e.g.,dnorm.- args
A list giving additional arguments to be passed to
dmath.- ...
Further arguments, typically graphical parameters, passed on to other low-level functions as appropriate. Color can usually be specified by
col,col.line, andcol.symbol, the last two overriding the first for lines and points respectively.- identifier
A character string that is prepended to the names of grobs that are created by this panel function.
Details
panel.abline adds a line of the form y = a + b * x, or
vertical and/or horizontal lines. Graphical parameters are obtained
from the “add.line” settings by default. panel.refline
is similar, but uses the “reference.line” settings for the
defaults.
panel.grid draws a reference grid.
panel.curve adds a curve, similar to what curve
does with add = TRUE. Graphical parameters for the curve are
obtained from the “add.line” setting.
panel.average treats one of x and y as a factor
(according to the value of horizontal), calculates fun
applied to the subsets of the other variable determined by each unique
value of the factor, and joins them by a line. Can be used in
conjunction with panel.xyplot, and more commonly with
panel.superpose to produce interaction plots.
panel.linejoin is an alias for panel.average. It is
retained for back-compatibility, and may go away in future.
panel.mathdensity plots a (usually theoretical) probability
density function. This can be useful in conjunction with
histogram and densityplot to visually assess goodness of
fit (note, however, that qqmath is more suitable for this).
panel.rug adds a rug representation of the (marginal)
data to the panel, much like rug.
panel.lmline(x, y) is equivalent to
panel.abline(lm(y ~ x)).
Author
Deepayan Sarkar Deepayan.Sarkar@R-project.org
Examples
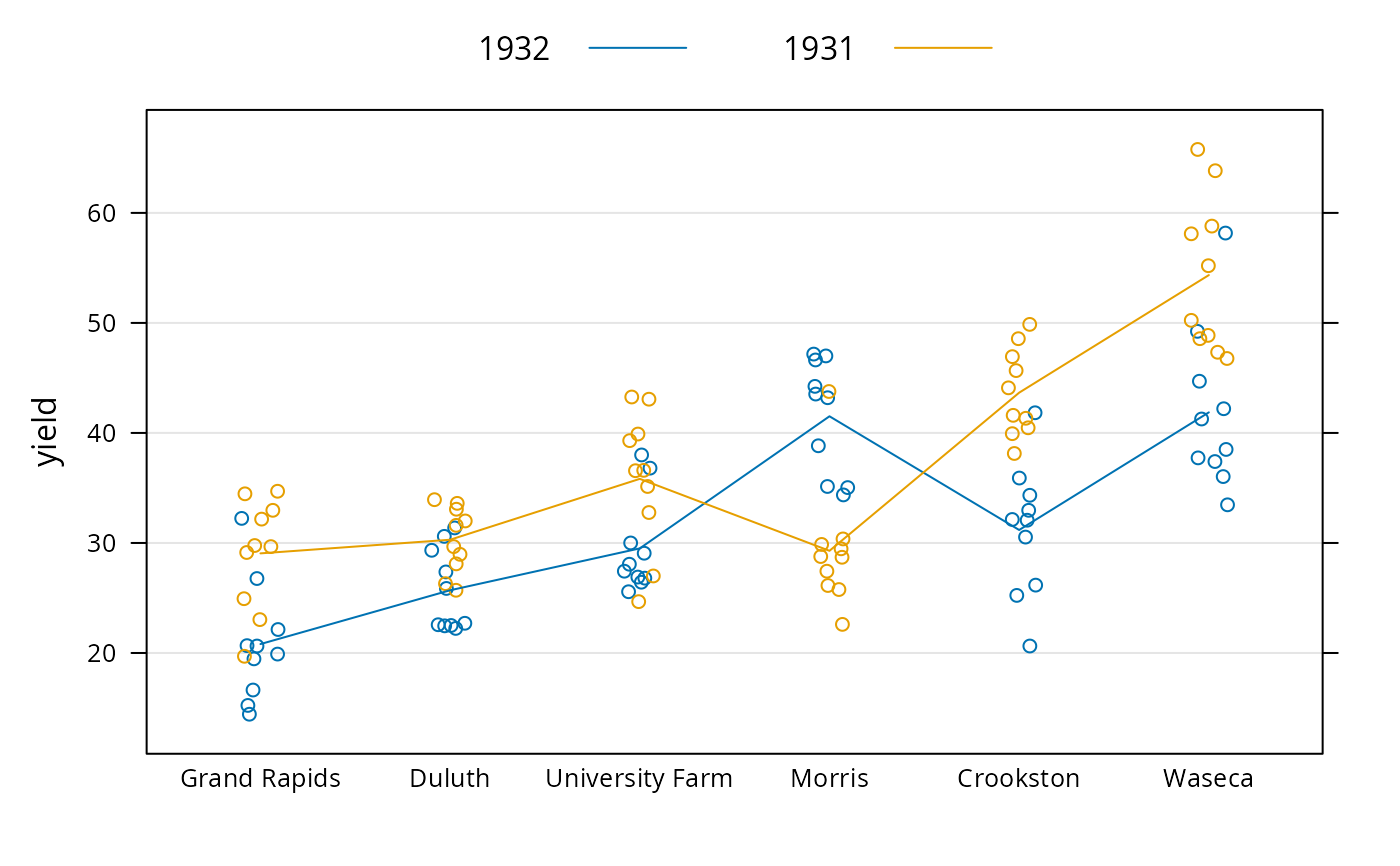
## Interaction Plot
bwplot(yield ~ site, barley, groups = year,
panel = function(x, y, groups, subscripts, ...) {
panel.grid(h = -1, v = 0)
panel.stripplot(x, y, ..., jitter.data = TRUE, grid = FALSE,
groups = groups, subscripts = subscripts)
panel.superpose(x, y, ..., panel.groups = panel.average, grid = FALSE,
groups = groups, subscripts = subscripts)
},
auto.key = list(points = FALSE, lines = TRUE, columns = 2))
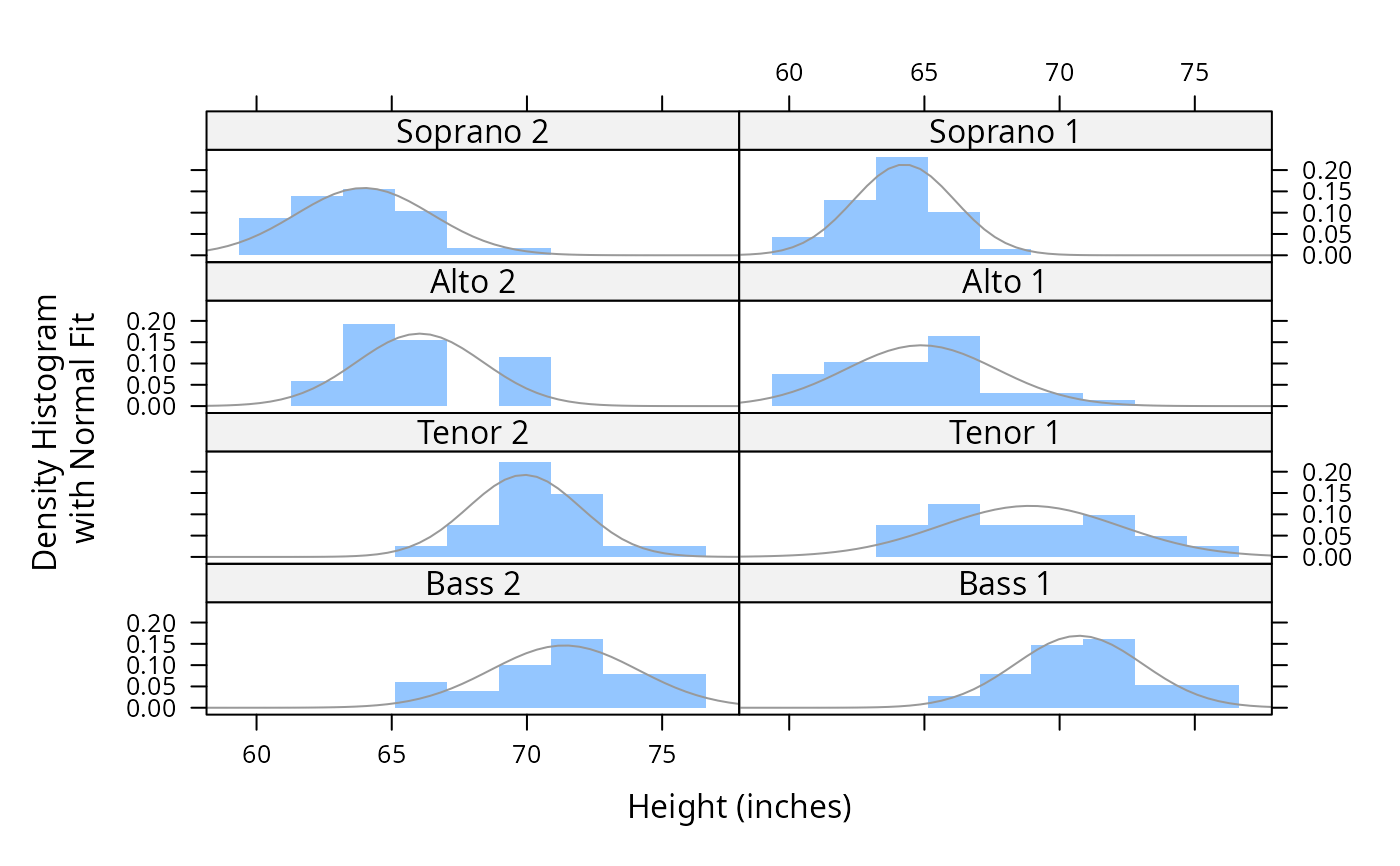
 ## Superposing a fitted normal density on a Histogram
histogram( ~ height | voice.part, data = singer, layout = c(2, 4),
type = "density", border = "transparent", col.line = "grey60",
xlab = "Height (inches)",
ylab = "Density Histogram\n with Normal Fit",
panel = function(x, ...) {
panel.histogram(x, ...)
panel.mathdensity(dmath = dnorm,
args = list(mean = mean(x), sd = sd(x)), ...)
} )
## Superposing a fitted normal density on a Histogram
histogram( ~ height | voice.part, data = singer, layout = c(2, 4),
type = "density", border = "transparent", col.line = "grey60",
xlab = "Height (inches)",
ylab = "Density Histogram\n with Normal Fit",
panel = function(x, ...) {
panel.histogram(x, ...)
panel.mathdensity(dmath = dnorm,
args = list(mean = mean(x), sd = sd(x)), ...)
} )