Plot and Summarize Trellis Objects
print.trellis.RdThe print and plot methods produce a graph from a
"trellis" object. The print method is necessary for
automatic plotting. plot method is essentially
an alias, provided for convenience. The summary method
gives a textual summary of the object. dim and dimnames
describe the cross-tabulation induced by conditioning.
panel.error is the default handler used when an error occurs
while executing the panel function.
Usage
# S3 method for class 'trellis'
plot(x, position, split,
     more = FALSE, newpage = TRUE,
     packet.panel = packet.panel.default,
     draw.in = NULL,
     panel.height = lattice.getOption("layout.heights")$panel,
     panel.width = lattice.getOption("layout.widths")$panel,
     save.object = lattice.getOption("save.object"),
     panel.error = lattice.getOption("panel.error"),
     prefix,
     ...)
# S3 method for class 'trellis'
print(x, ...)

# S3 method for class 'trellis'
summary(object, ...)

# S3 method for class 'trellis'
dim(x)
# S3 method for class 'trellis'
dimnames(x)

panel.error(e)
Arguments
- x, object
an object of class
"trellis"- position
a vector of 4 numbers, typically c(xmin, ymin, xmax, ymax) that give the lower-left and upper-right corners of a rectangle in which the Trellis plot of x is to be positioned. The coordinate system for this rectangle is [0-1] in both the x and y directions.
- split
a vector of 4 integers, c(x,y,nx,ny) , that says to position the current plot at the x,y position in a regular array of nx by ny plots. (Note: this has origin at top left)
- more
A logical specifying whether more plots will follow on this page.
- newpage
A logical specifying whether the plot should be on a new page. This option is specific to lattice, and is useful for including lattice plots in an arbitrary grid viewport (see the details section).
- packet.panel
a function that determines which packet (data subset) is plotted in which panel. Panels are always drawn in an order such that columns vary the fastest, then rows and then pages. This function determines, given the column, row and page and other relevant information, the packet (if any) which should be used in that panel. By default, the association is determnined by matching panel order with packet order, which is determined by varying the first conditioning variable the fastest, then the second, and so on. This association rule is encoded in the default, namely the function
packet.panel.default, whose help page details the arguments supplied to whichever function is specified as thepacket.panelargument.- draw.in
An optional (grid) viewport (used as the
nameargument indownViewport) in which the plot is to be drawn. If specified, thenewpageargument is ignored. This feature is not well-tested.- panel.width, panel.height
lists with 2 components, that should be valid
xandunitsarguments tounit()(thedataargument cannot be specified currently, but can be considered for addition if needed). The resultingunitobject will be the width/height of each panel in the Lattice plot. These arguments can be used to explicitly control the dimensions of the panel, rather than letting them expand to maximize available space. Vector widths are allowed, and can specify unequal lengths across rows or columns.Note that this option should not be used in conjunction with non-default values of the
aspectargument in the original high level call (no error will be produced, but the resulting behaviour is undefined).- save.object
logical, specifying whether the object being printed is to be saved. The last object thus saved can be subsequently retrieved. This is an experimental feature that should allow access to a panel's data after the plot is done, making it possible to enhance the plot after the fact. This also allows the user to invoke the
updatemethod on the current plot, even if it was not assigned to a variable explicitly. For more details, seetrellis.focus.- panel.error
a function, or a character string naming a function, that is to be executed when an error occurs during the execution of the panel function. The error is caught (using
tryCatch) and supplied as the only argument topanel.error. The default behaviour (implemented as thepanel.errorfunction) is to print the corresponding error message in the panel and continue. To stop execution on error, usepanel.error = stop.Normal error recovery and debugging tools are unhelpful when
tryCatchis used.tryCatchcan be completely bypassed by settingpanel.errorto NULL.- prefix
A character string acting as a prefix identifying the plot of a
"trellis"object, primarily used in constructing viewport and grob names, to distinguish similar viewports if a page contains multiple plots. The default is based on the serial number of the current plot on the current page (specifically,"plot_01","plot_02", etc.). If supplied explicitly, this must be a valid R symbol name (briefly, it must start with a letter or a period followed by a letter) and must not contain the grid path separator (currently"::").- e
an error condition caught by
tryCatch- ...
extra arguments, ignored by the
printmethod. All arguments to theplotmethod are passed on to theprintmethod.
Details
This is the default print method for objects of class
"trellis", produced by calls to functions like xyplot,
bwplot etc. It is usually called automatically when a trellis
object is produced. It can also be called explicitly to control plot
positioning by means of the arguments split and
position.
When newpage = FALSE, the current grid viewport is treated as
the plotting area, making it possible to embed a Lattice plot inside
an arbitrary grid viewport. The draw.in argument provides an
alternative mechanism that may be simpler to use.
The print method uses the information in x (the object to be
printed) to produce a display using the Grid graphics engine. At the
heart of the plot is a grid layout, of which the entries of most
interest to the user are the ones containing the display panels.
Unlike in older versions of Lattice (and Grid), the grid display tree
is retained after the plot is produced, making it possible to access
individual viewport locations and make additions to the plot. For
more details and a lattice level interface to these viewports, see
trellis.focus.
Note
Unlike S-PLUS, trying to position a multipage display (using
position and/or split) will mess things up.
Author
Deepayan Sarkar Deepayan.Sarkar@R-project.org
Examples
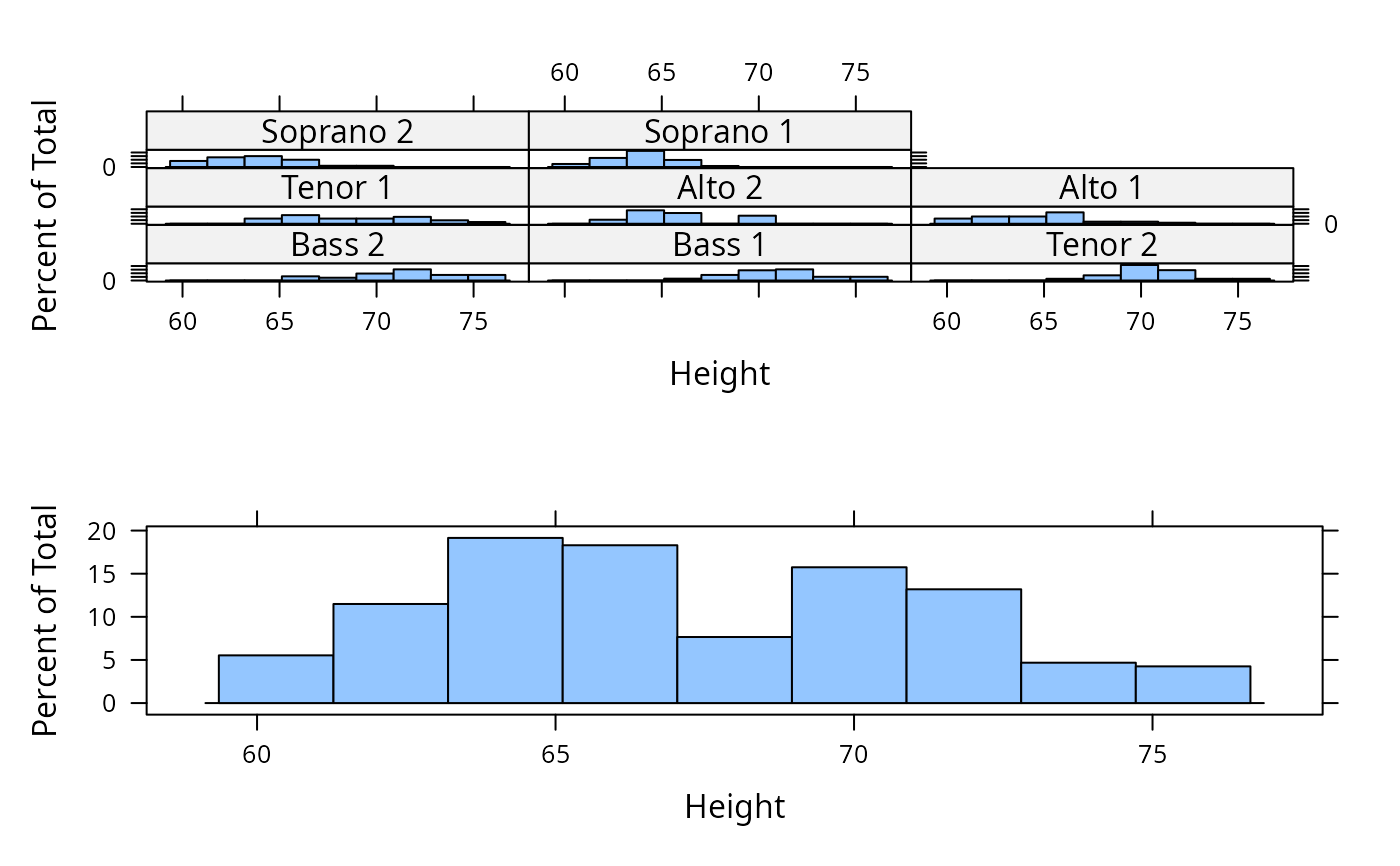
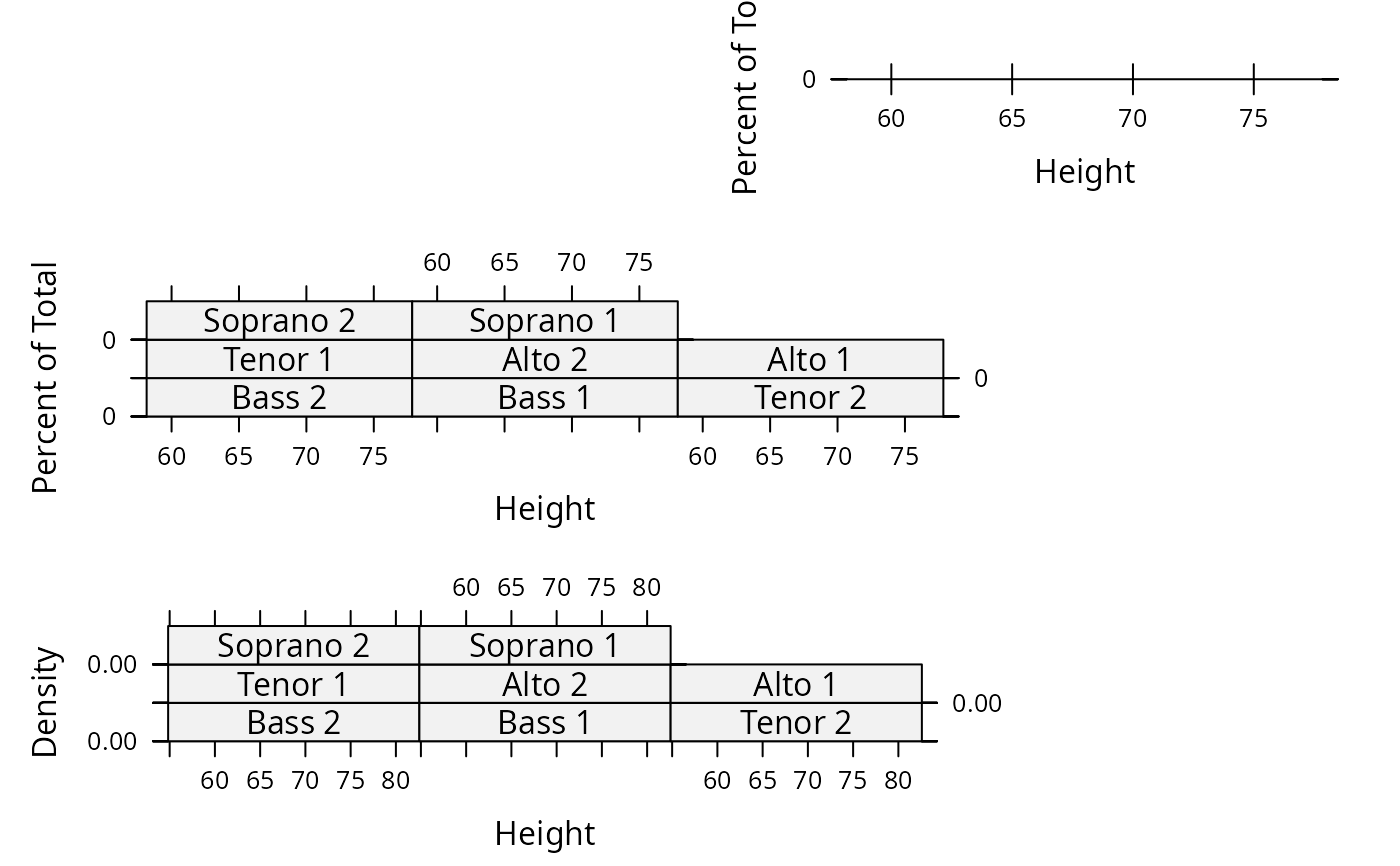
p11 <- histogram( ~ height | voice.part, data = singer, xlab="Height")
p12 <- densityplot( ~ height | voice.part, data = singer, xlab = "Height")
p2 <- histogram( ~ height, data = singer, xlab = "Height")
## simple positioning by split
print(p11, split=c(1,1,1,2), more=TRUE)
print(p2, split=c(1,2,1,2))
 ## Combining split and position:
print(p11, position = c(0,0,.75,.75), split=c(1,1,1,2), more=TRUE)
print(p12, position = c(0,0,.75,.75), split=c(1,2,1,2), more=TRUE)
print(p2, position = c(.5,.75,1,1), more=FALSE)
## Combining split and position:
print(p11, position = c(0,0,.75,.75), split=c(1,1,1,2), more=TRUE)
print(p12, position = c(0,0,.75,.75), split=c(1,2,1,2), more=TRUE)
print(p2, position = c(.5,.75,1,1), more=FALSE)
 ## Using seekViewport
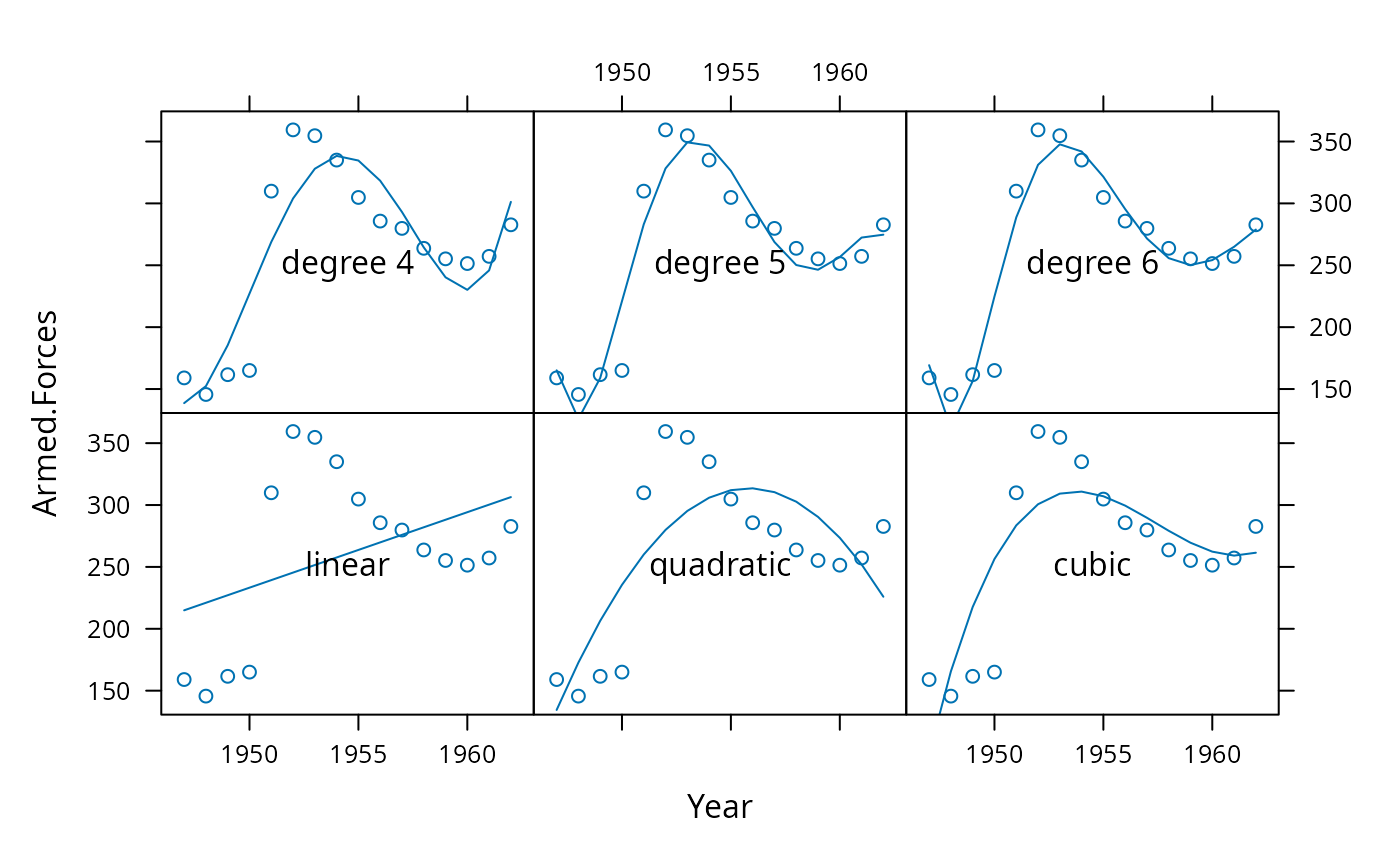
## repeat same plot, with different polynomial fits in each panel
xyplot(Armed.Forces ~ Year, longley, index.cond = list(rep(1, 6)),
layout = c(3, 2),
panel = function(x, y, ...)
{
panel.xyplot(x, y, ...)
fm <- lm(y ~ poly(x, panel.number()))
llines(x, predict(fm))
})
if (FALSE) { # \dontrun{
grid::seekViewport(trellis.vpname("panel", 1, 1))
cat("Click somewhere inside the first panel:\n")
ltext(grid::grid.locator(), lab = "linear")
} # }
grid::seekViewport(trellis.vpname("panel", 1, 1))
grid::grid.text("linear")
grid::seekViewport(trellis.vpname("panel", 2, 1))
grid::grid.text("quadratic")
grid::seekViewport(trellis.vpname("panel", 3, 1))
grid::grid.text("cubic")
grid::seekViewport(trellis.vpname("panel", 1, 2))
grid::grid.text("degree 4")
grid::seekViewport(trellis.vpname("panel", 2, 2))
grid::grid.text("degree 5")
grid::seekViewport(trellis.vpname("panel", 3, 2))
grid::grid.text("degree 6")
## Using seekViewport
## repeat same plot, with different polynomial fits in each panel
xyplot(Armed.Forces ~ Year, longley, index.cond = list(rep(1, 6)),
layout = c(3, 2),
panel = function(x, y, ...)
{
panel.xyplot(x, y, ...)
fm <- lm(y ~ poly(x, panel.number()))
llines(x, predict(fm))
})
if (FALSE) { # \dontrun{
grid::seekViewport(trellis.vpname("panel", 1, 1))
cat("Click somewhere inside the first panel:\n")
ltext(grid::grid.locator(), lab = "linear")
} # }
grid::seekViewport(trellis.vpname("panel", 1, 1))
grid::grid.text("linear")
grid::seekViewport(trellis.vpname("panel", 2, 1))
grid::grid.text("quadratic")
grid::seekViewport(trellis.vpname("panel", 3, 1))
grid::grid.text("cubic")
grid::seekViewport(trellis.vpname("panel", 1, 2))
grid::grid.text("degree 4")
grid::seekViewport(trellis.vpname("panel", 2, 2))
grid::grid.text("degree 5")
grid::seekViewport(trellis.vpname("panel", 3, 2))
grid::grid.text("degree 6")