Creates a VPC plot from observed and simulation data
Usage
vpc(sim, ...)

# Default S3 method
vpc(sim, ...)

vpc_vpc(
  sim = NULL,
  obs = NULL,
  psn_folder = NULL,
  bins = "jenks",
  n_bins = "auto",
  bin_mid = "mean",
  obs_cols = NULL,
  sim_cols = NULL,
  software = "auto",
  show = NULL,
  stratify = NULL,
  pred_corr = FALSE,
  pred_corr_lower_bnd = 0,
  pi = c(0.05, 0.95),
  ci = c(0.05, 0.95),
  uloq = NULL,
  lloq = NULL,
  log_y = FALSE,
  log_y_min = 0.001,
  xlab = NULL,
  ylab = NULL,
  title = NULL,
  smooth = TRUE,
  vpc_theme = NULL,
  facet = "wrap",
  scales = "fixed",
  labeller = NULL,
  vpcdb = FALSE,
  verbose = FALSE,
  ...
)
Arguments
- sim
this is usually a data.frame with observed data, containing the independent and dependent variable, a column indicating the individual, and possibly covariates. E.g. load in from NONMEM using read_table_nm. However it can also be an object like a nlmixr or xpose object
- ...
Other arguments sent to other methods (like xpose or nlmixr); Note these arguments are not used in the default vpc and are ignored by the default method.
- obs
a data.frame with observed data, containing the independent and dependent variable, a column indicating the individual, and possibly covariates. E.g. load in from NONMEM using read_table_nm
- psn_folder
instead of specifying "sim" and "obs", specify a PsN-generated VPC-folder
- bins
either "density", "time", or "data", "none", or one of the approaches available in classInterval() such as "jenks" (default) or "pretty", or a numeric vector specifying the bin separators.
- n_bins
when using the "auto" binning method, what number of bins to aim for
- bin_mid
either "mean" for the mean of all timepoints (default) or "middle" to use the average of the bin boundaries.
- obs_cols
list for mapping observation data columns, e.g. `list(dv = "DV", id = "ID", idv = "TIME", pred="PRED")`
- sim_cols
list for mapping simulation data columns, e.g. `list(dv = "DV", id = "ID", idv = "TIME", pred="PRED")`
- software
name of software platform using (e.g. nonmem, phoenix)
- show
what to show in VPC (obs_dv, obs_ci, pi, pi_as_area, pi_ci, obs_median, sim_median, sim_median_ci)
- stratify
character vector of stratification variables. Only 1 or 2 stratification variables can be supplied.
- pred_corr
perform prediction-correction?
- pred_corr_lower_bnd
lower bound for the prediction-correction
- pi
simulated prediction interval to plot. Default is c(0.05, 0.95),
- ci
confidence interval to plot. Default is (0.05, 0.95)
- uloq
Number or NULL indicating upper limit of quantification. Default is NULL.
- lloq
Number or NULL indicating lower limit of quantification. Default is NULL.
- log_y
Boolean indicting whether y-axis should be shown as logarithmic. Default is FALSE.
- log_y_min
minimal value when using log_y argument. Default is 1e-3.
- xlab
label for x axis
- ylab
label for y axis
- title
title
- smooth
"smooth" the VPC (connect bin midpoints) or show bins as rectangular boxes. Default is TRUE.
- vpc_theme
theme to be used in VPC. Expects list of class vpc_theme created with function vpc_theme()
- facet
either "wrap", "columns", or "rows"
- scales
Are scales shared across all facets (the default,
"fixed"), or do they vary across rows ("free_x"), columns ("free_y"), or both rows and columns ("free")?- labeller
ggplot2 labeller function to be passed to underlying ggplot object
- vpcdb
Boolean whether to return the underlying vpcdb rather than the plot
- verbose
show debugging information (TRUE or FALSE)
Examples
## See vpc.ronkeizer.com for more documentation and examples
library(vpc)
# Basic commands:
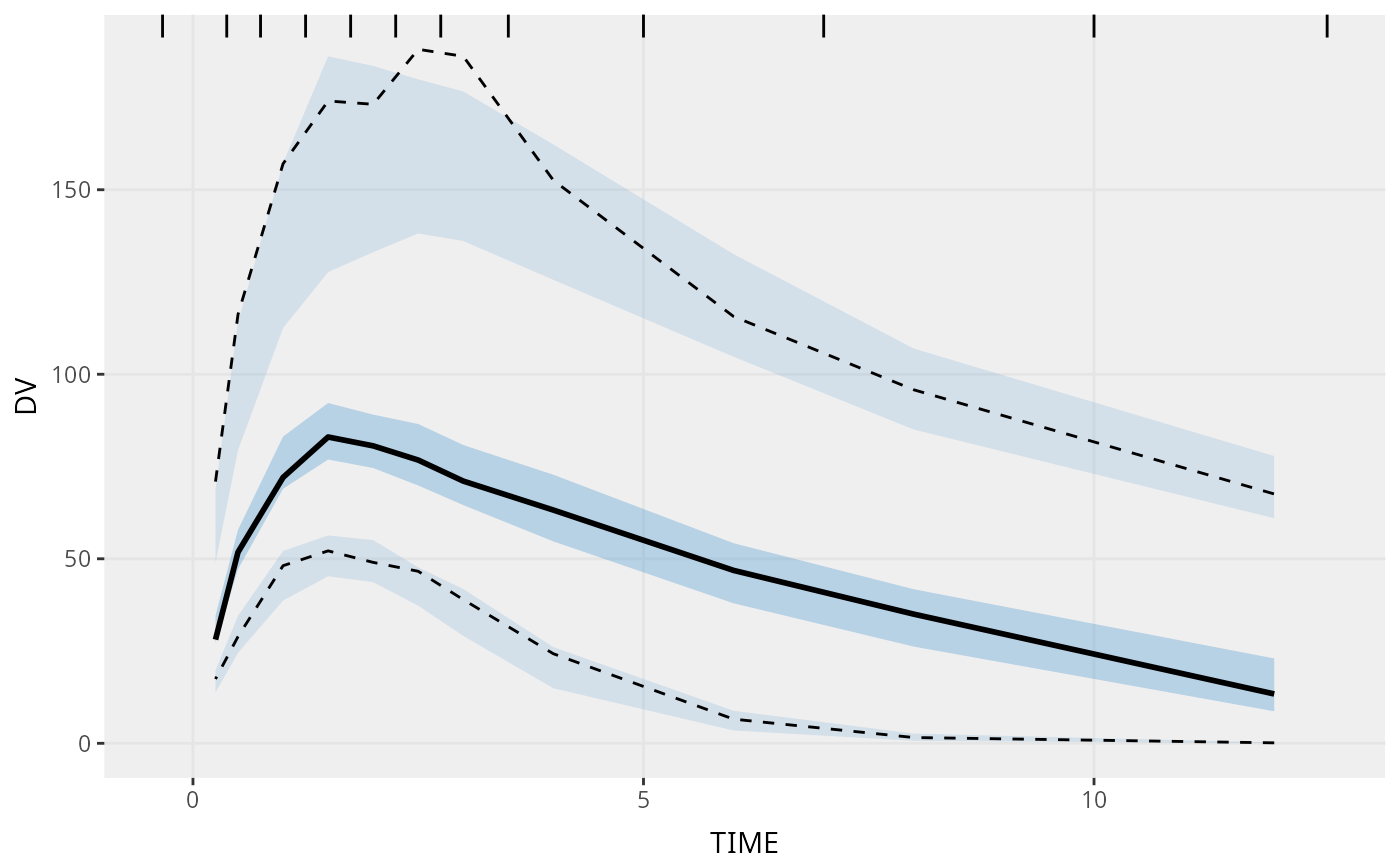
vpc(sim = simple_data$sim, obs = simple_data$obs)
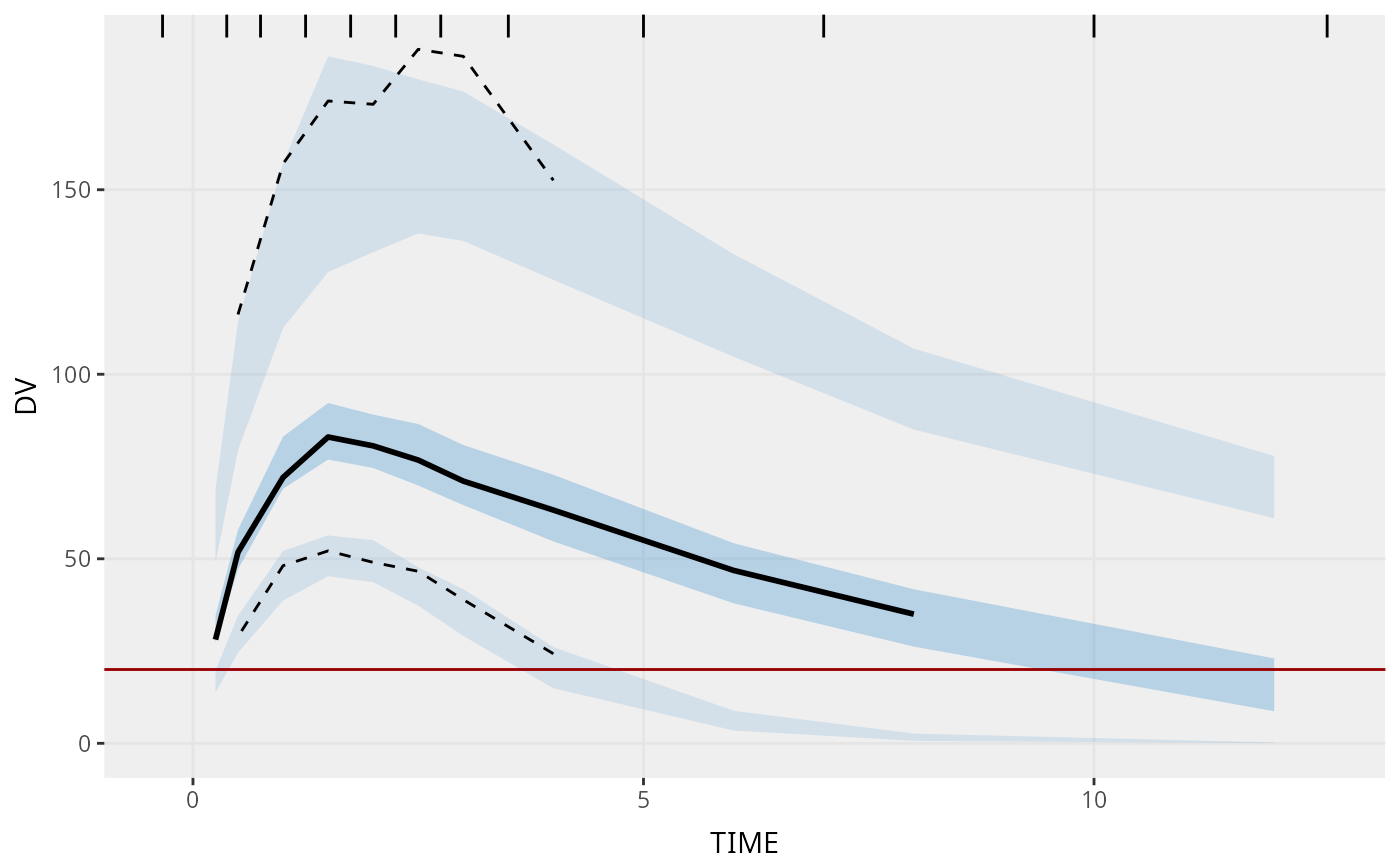
 vpc(sim = simple_data$sim, obs = simple_data$obs, lloq = 20)
#> Warning: Removed 1 row containing missing values or values outside the scale range
#> (`geom_line()`).
#> Warning: Removed 4 rows containing missing values or values outside the scale range
#> (`geom_ribbon()`).
vpc(sim = simple_data$sim, obs = simple_data$obs, lloq = 20)
#> Warning: Removed 1 row containing missing values or values outside the scale range
#> (`geom_line()`).
#> Warning: Removed 4 rows containing missing values or values outside the scale range
#> (`geom_ribbon()`).