adds colored circle to a plot
filledcircle.Rdplots (part of) outer and inner circle and colors inbetween; color can be a palette.
Arguments
- r1
radius of outer circle.
- r2
radius of inner circle.
- mid
midpoint of circle.
- dr
size of segments, in radians, to draw circle (decrease for smoother).
- from
starting angle for circle segment, radians.
- to
final angle for circle segment, radians. The segment is drawn counterclockwise. The default is to draw a full circle.
- col
color palette to be used; also allowed are two extremes or one value.
- values
if not
NULL, a matrix providing (radius,z-values) couples, used for coloring. .- zlim
Only if
valuesis notNULL: the minimum and maximum z values for which colors should be plotted, defaulting to the range of the finite values of the second column ofvalues.- lwd
width of external line.
- lcol
line color.
- ...
arguments passed to R-function polygon.
Value
returns, as invisible a list containing "xyouter" and "xyinner", the points that define the outer and inner ellipse.
Details
see filledellipse for details
See also
Examples
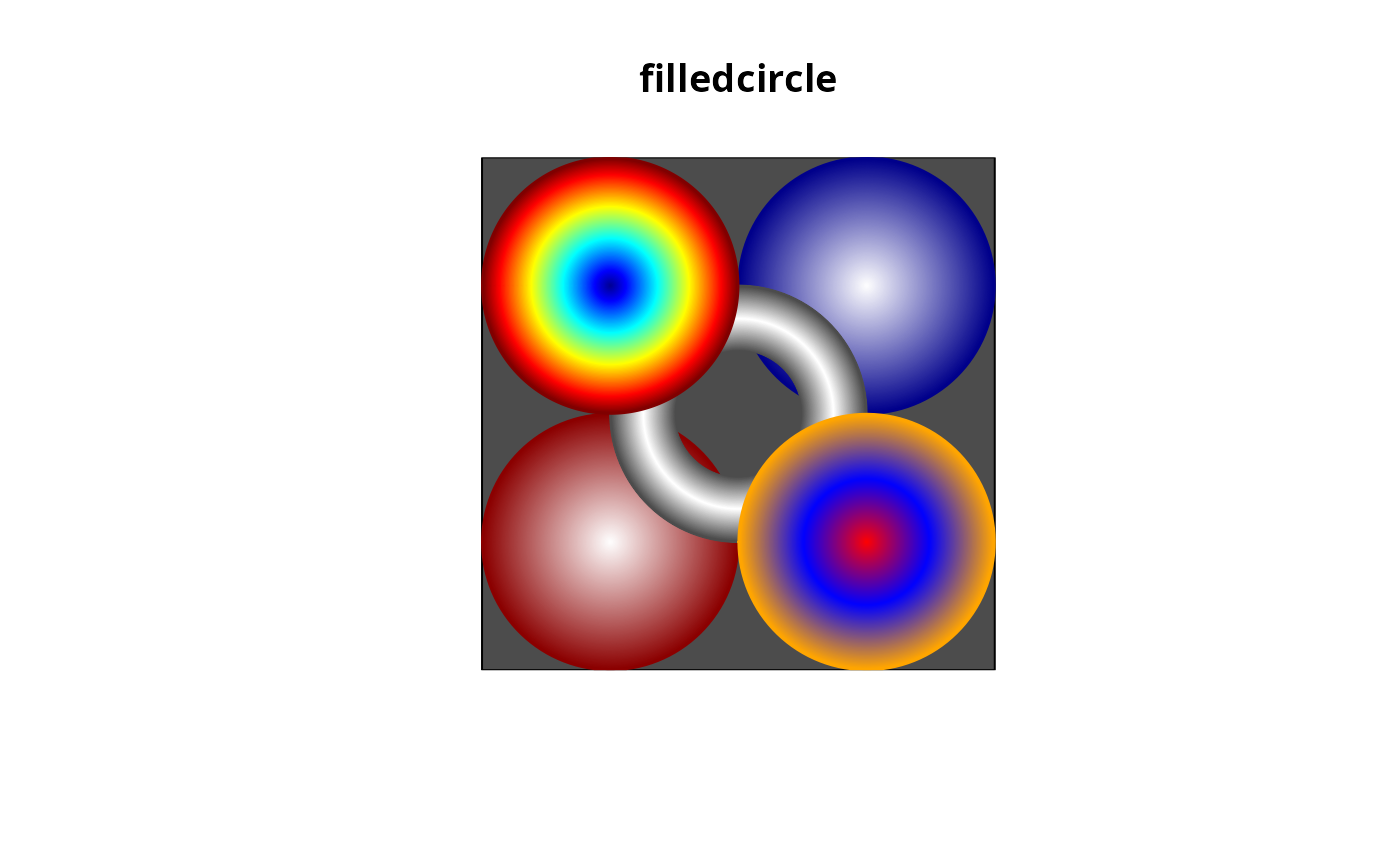
color <-graycol(n = 50)
dr <- 0.05
emptyplot(xlim = c(-2, 2), col = color[length(color)],
main = "filledcircle")
filledcircle(r1 = 1, mid = c(1, 1), dr = dr,
col = shadepalette(endcol = "darkblue"))
filledcircle(r1 = 1, mid = c(-1, -1), dr = dr,
col = shadepalette(endcol = "darkred"))
filledcircle(r1 = 1, r2 = 0.5, mid = c(0, 0), dr = dr,
col = c(rev(color), color))
filledcircle(r1 = 1, mid = c(1, -1), dr = dr,
col = intpalette(c("red", "blue", "orange"), 100))
filledcircle(mid = c(-1, 1))
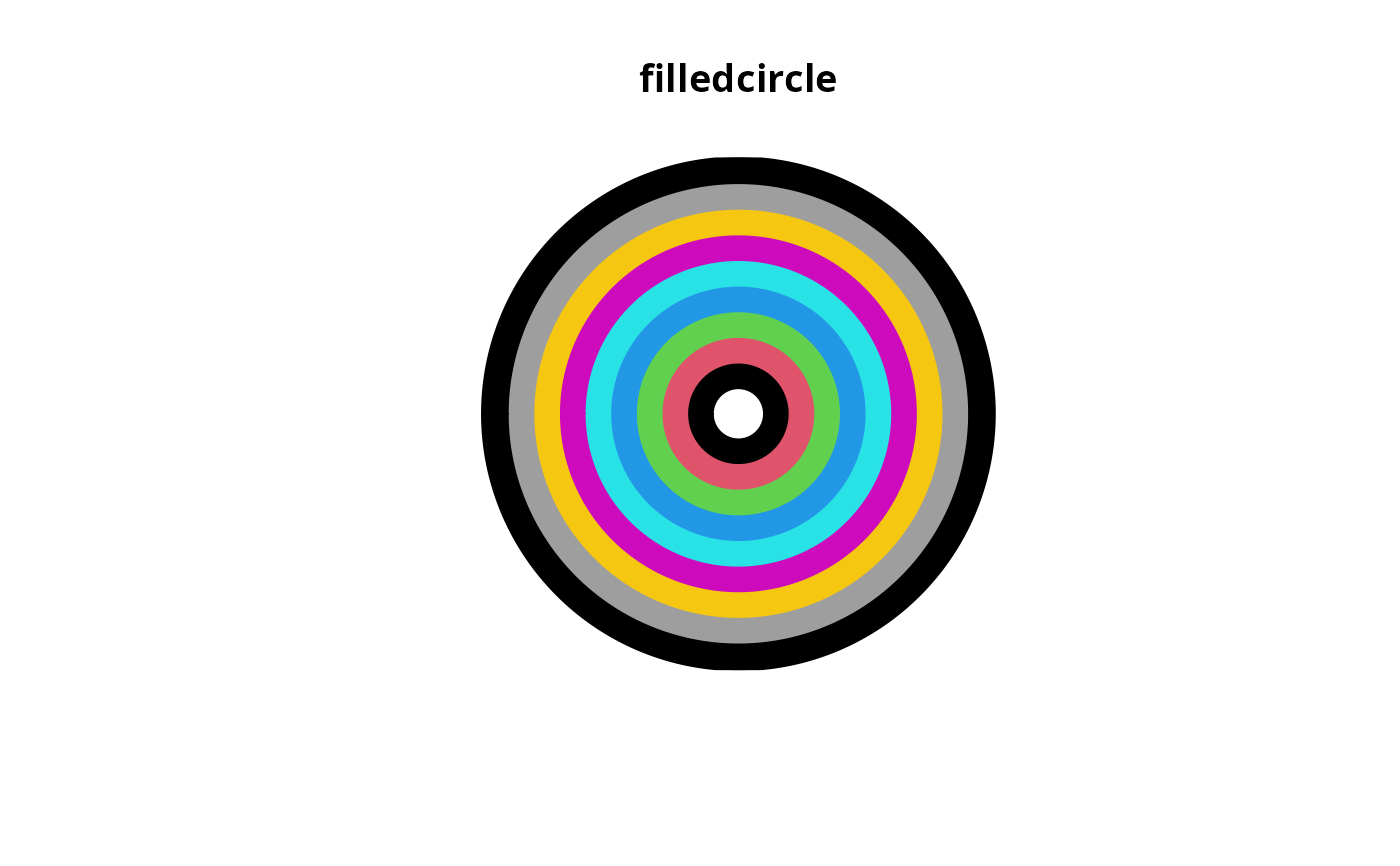
 emptyplot(main = "filledcircle")
for (i in seq(0, 0.45, 0.05))
filledcircle(r1 = i+0.05, r2 = i,
mid = c(0.5, 0.5), col = i*20)
emptyplot(main = "filledcircle")
for (i in seq(0, 0.45, 0.05))
filledcircle(r1 = i+0.05, r2 = i,
mid = c(0.5, 0.5), col = i*20)