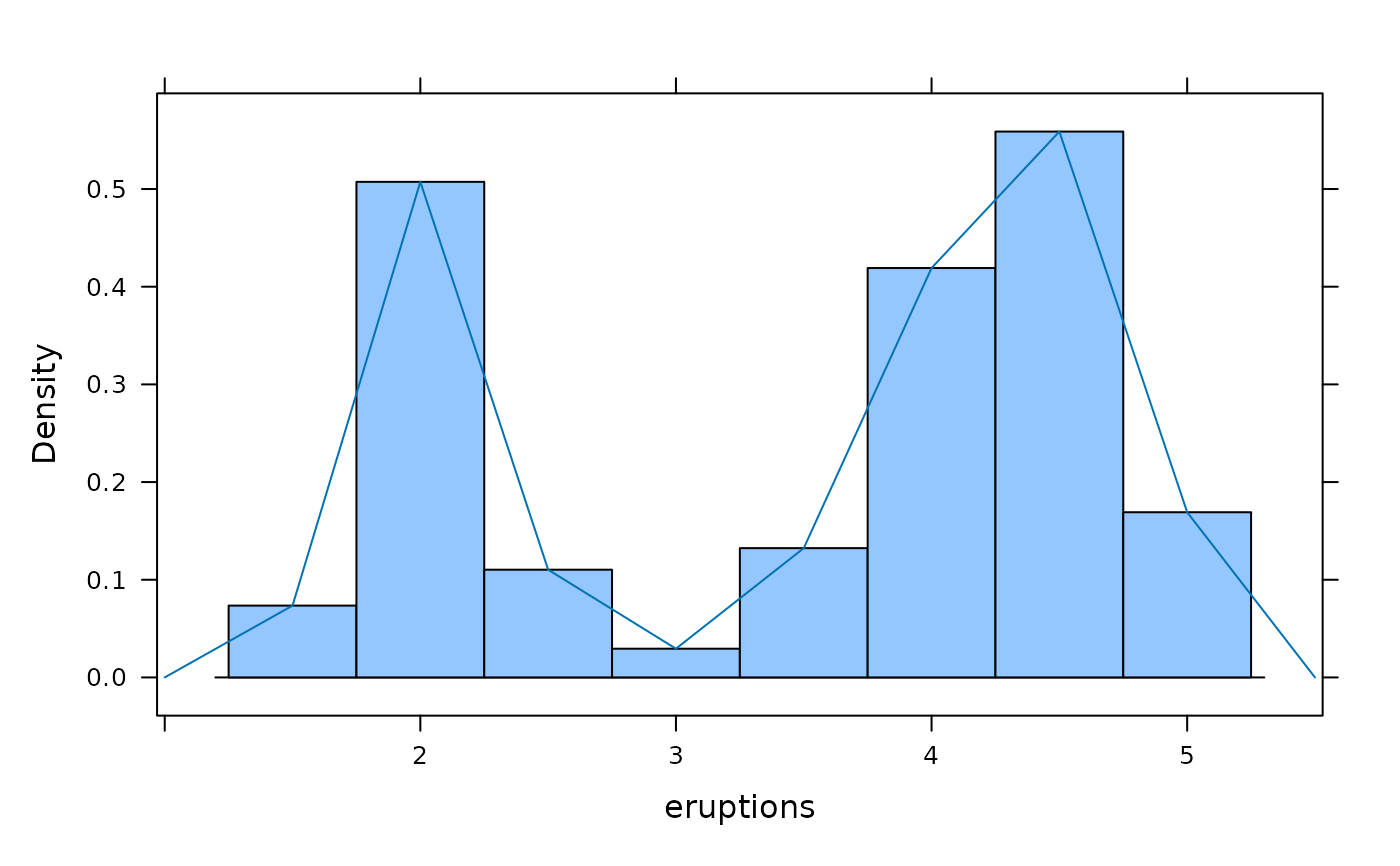
Frequency polygons are an alternative to histograms that make it simpler to overlay multiple distributions.
Usage
freqpolygon(
  x,
  ...,
  panel = "panel.freqpolygon",
  prepanel = "prepanel.default.freqpolygon"
)

prepanel.default.freqpolygon(
  x,
  darg = list(),
  plot.points = FALSE,
  ref = FALSE,
  groups = NULL,
  subscripts = TRUE,
  jitter.amount = 0.01 * diff(current.panel.limits()$ylim),
  center = NULL,
  nint = NULL,
  breaks = NULL,
  width = darg$width,
  type = "density",
  ...
)

panel.freqpolygon(
  x,
  darg = list(),
  plot.points = FALSE,
  ref = FALSE,
  groups = NULL,
  weights = NULL,
  jitter.amount = 0.01 * diff(current.panel.limits()$ylim),
  type = "density",
  breaks = NULL,
  nint = NULL,
  center = NULL,
  width = darg$width,
  gcol = trellis.par.get("reference.line")$col,
  glwd = trellis.par.get("reference.line")$lwd,
  h,
  v,
  ...,
  identifier = "freqpoly"
)
Arguments
- x
a formula or a numeric vector
- ...
additional arguments passed on to
histogram()andpanel.- panel
a panel function
- prepanel
a prepanel function
- darg
a list of arguments for the function computing the frequency polygon. This exists primarily for compatibility with
densityplotand is unlikely to be needed by the end user.- plot.points
one of
TRUE,FALSE,"jitter", or"rug"indicating how points are to be displayed- ref
a logical indicating whether a horizontal reference line should be added (roughly equivalent to
h=0)- groups, weights, jitter.amount, identifier
as in
lattice::densityplot()orhistogram()- subscripts
as in other lattice prepanel functions
- center
center of one of the bins
- nint
an approximate number of bins for the frequency polygon
- breaks
a vector of breaks for the frequency polygon bins
- width
width of the bins
- type
one of
'density','percent', or'count'- gcol
color of guidelines
- glwd
width of guidelines
- h, v
a vector of values for additional horizontal and vertical lines
Note
This function make use of histogram to determine overall layout. Often
this works reasonably well but sometimes it does not. In particular, when groups is
used to overlay multiple frequency polygons, there is often too little head room.
In the latter cases, it may be
necessary to use ylim to determine an appropriate viewing rectangle for the
plot.
Examples
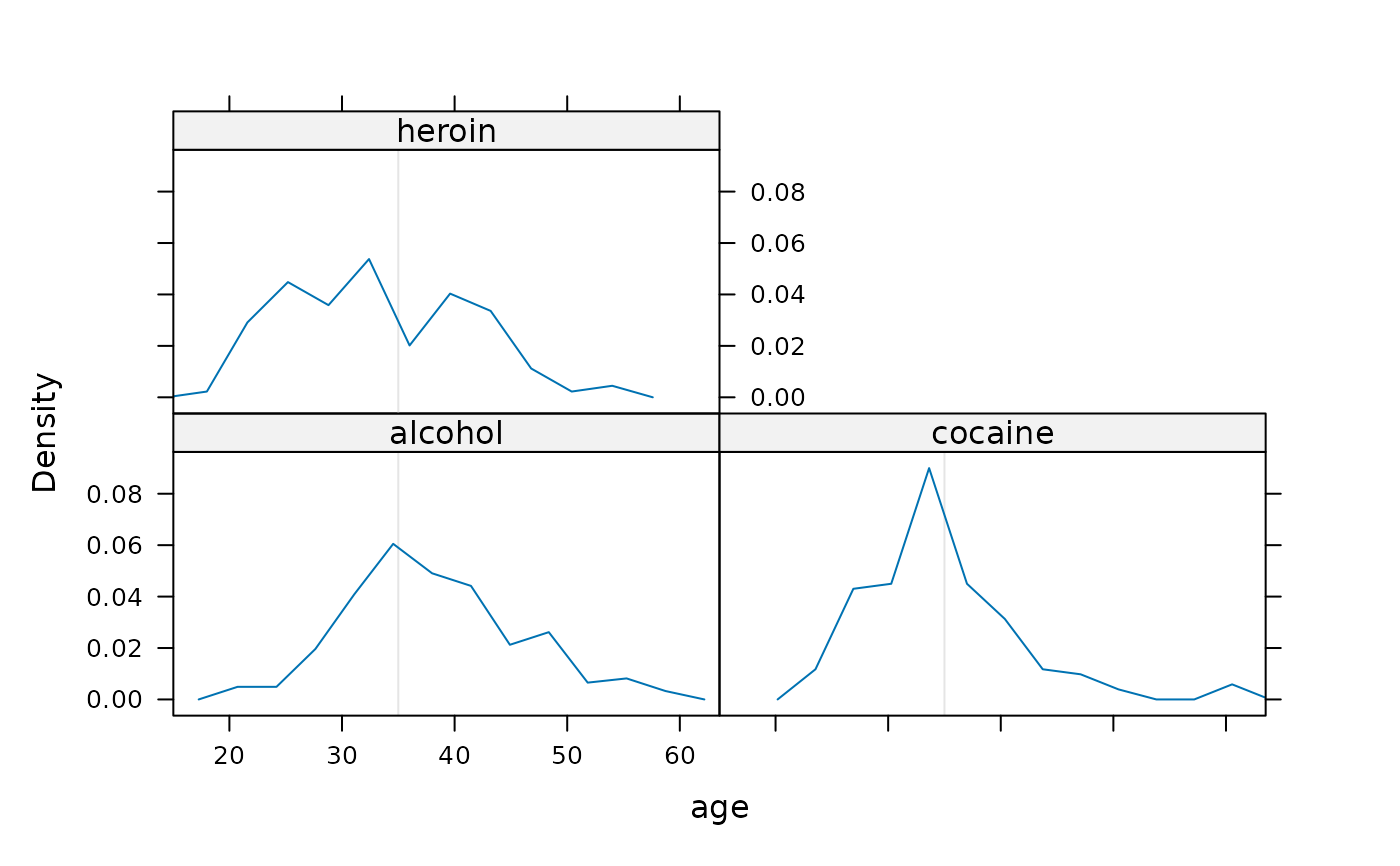
freqpolygon(~age | substance, data=HELPrct, v=35)
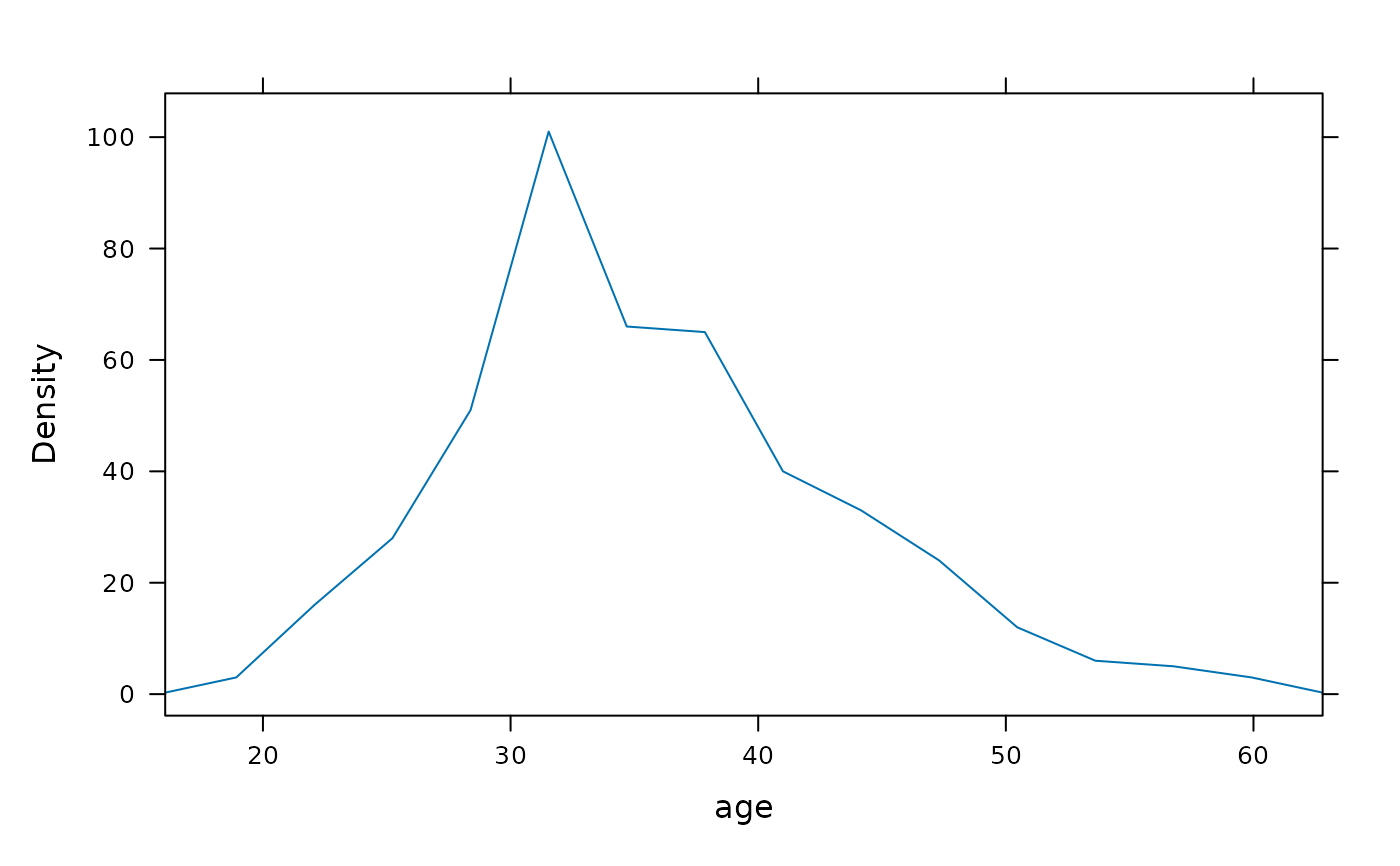
 freqpolygon(~age, data=HELPrct, labels=TRUE, type='count')
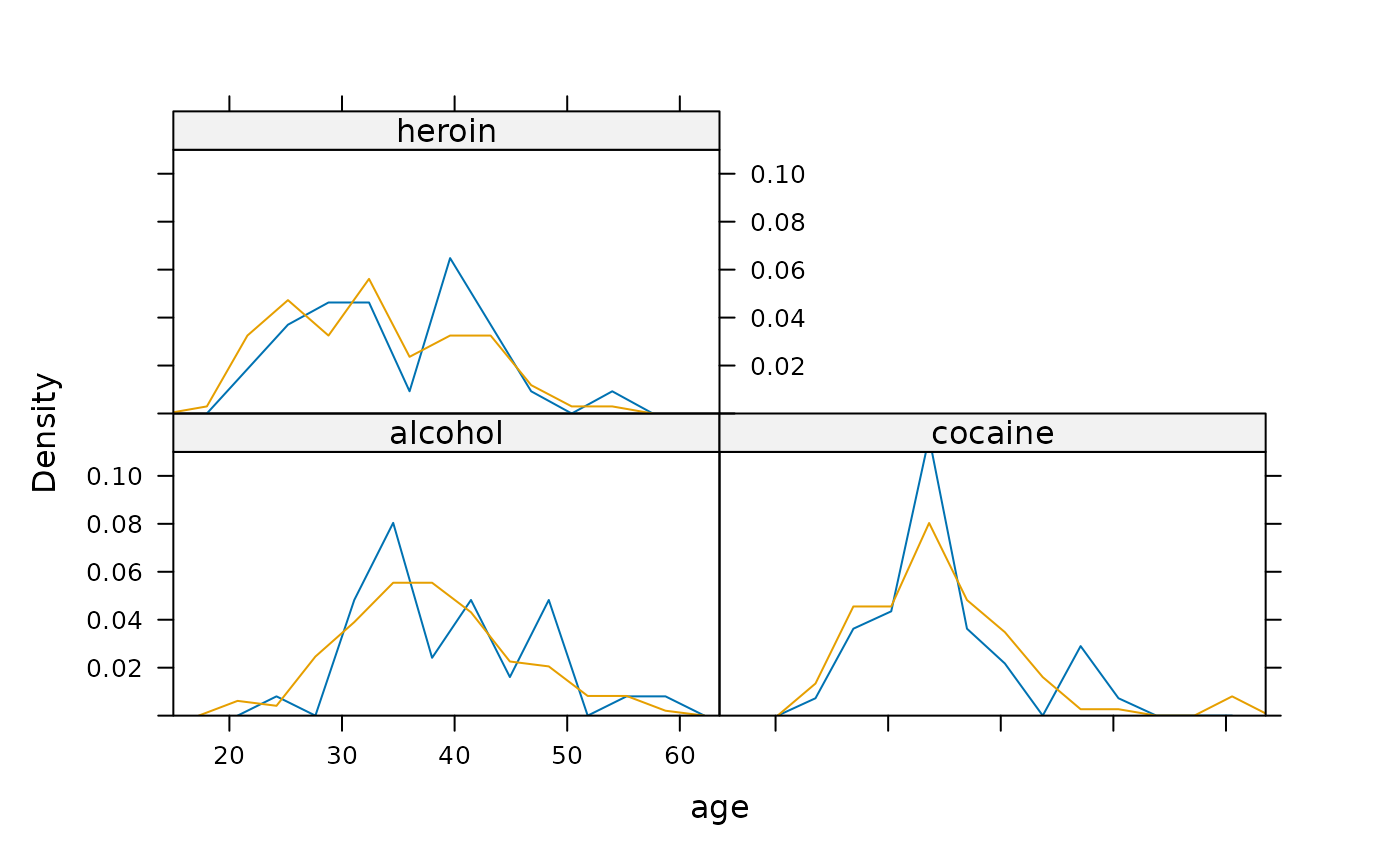
 freqpolygon(~age | substance, data=HELPrct, groups=sex)
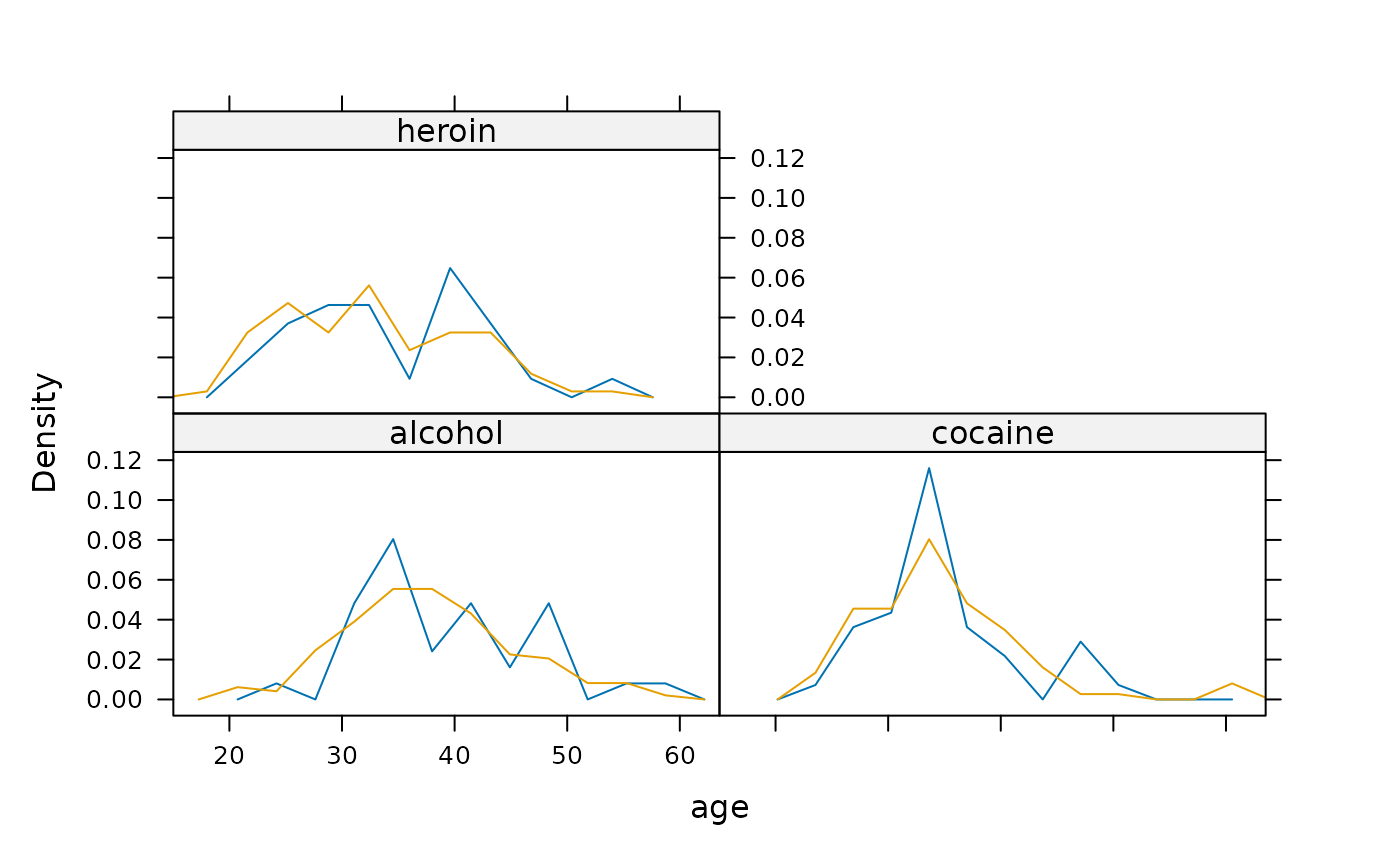 freqpolygon(~age | substance, data=HELPrct, groups=sex, ylim=c(0,0.11))
 ## comparison of histogram and frequency polygon
histogram(~eruptions, faithful, type='density', width=.5)
## comparison of histogram and frequency polygon
histogram(~eruptions, faithful, type='density', width=.5)
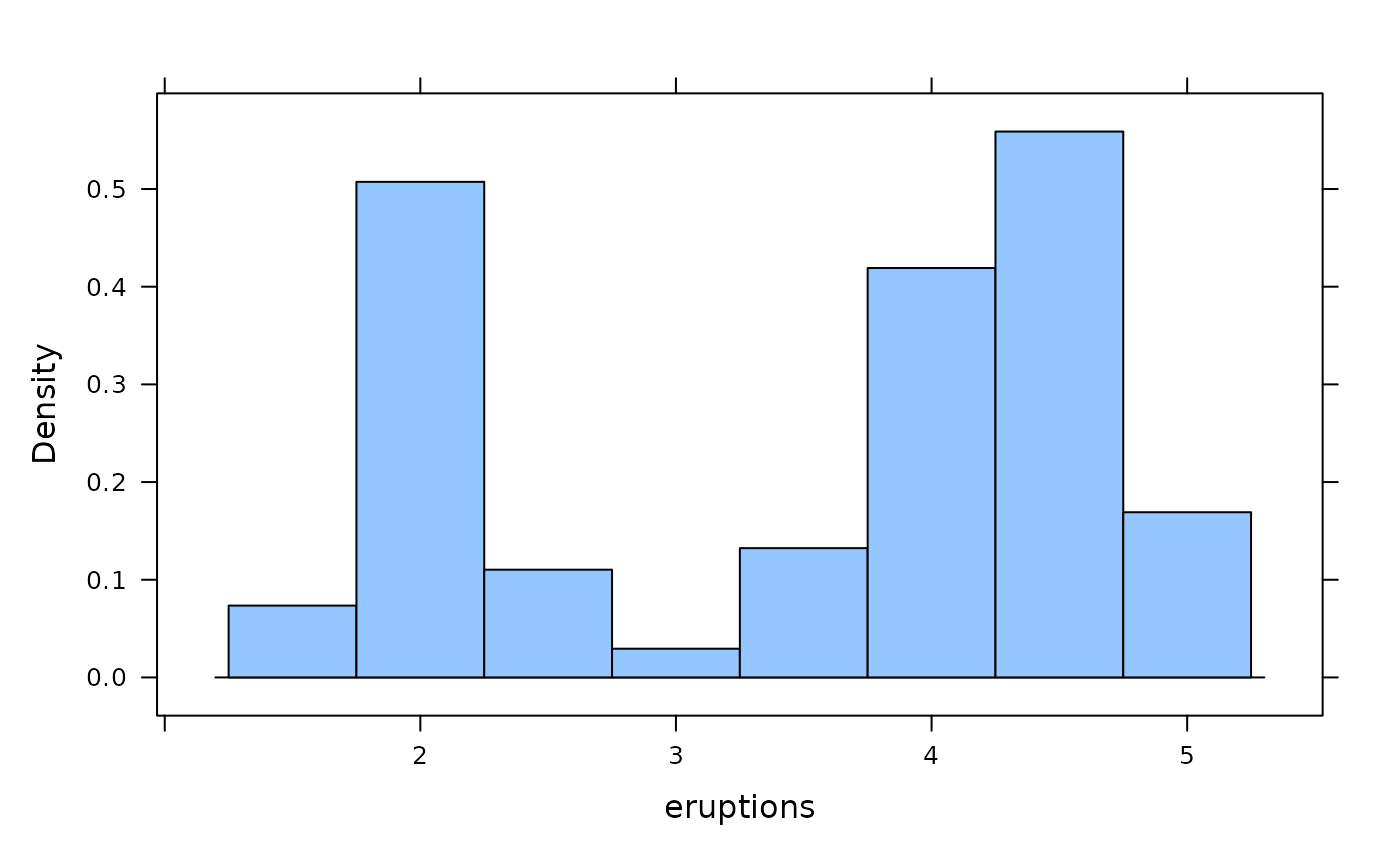 ladd( panel.freqpolygon(faithful$eruptions, width=.5 ))