Simplified lattice plotting by adding additional elements to existing plots.
Arguments
- x
callable graphical element to be added to a panel or panels in a lattice plot
- data
a list containing objects that can be referred to in
x. Panel functions also have access to the data already used in the panel by the underlying lattice plot. SeelatticeExtra::layer()for details.- ...
additional arguments passed to
latticeExtra::layer().- plot
a lattice plot to add to. Defaults to previous lattice plot.
Details
ladd is a wrapper around latticeExtra::layer() that simplifies
certain common plotting additions. The same caveats that apply to that function
apply here as well. In particular, ladd uses non-standard evaluation.
For this reason care must be taken if trying to use ladd within other functions
and the use of data may be required to pass information into the environment
in which x will be evaluated.
Author
Randall Pruim (rpruim@calvin.edu)
Examples
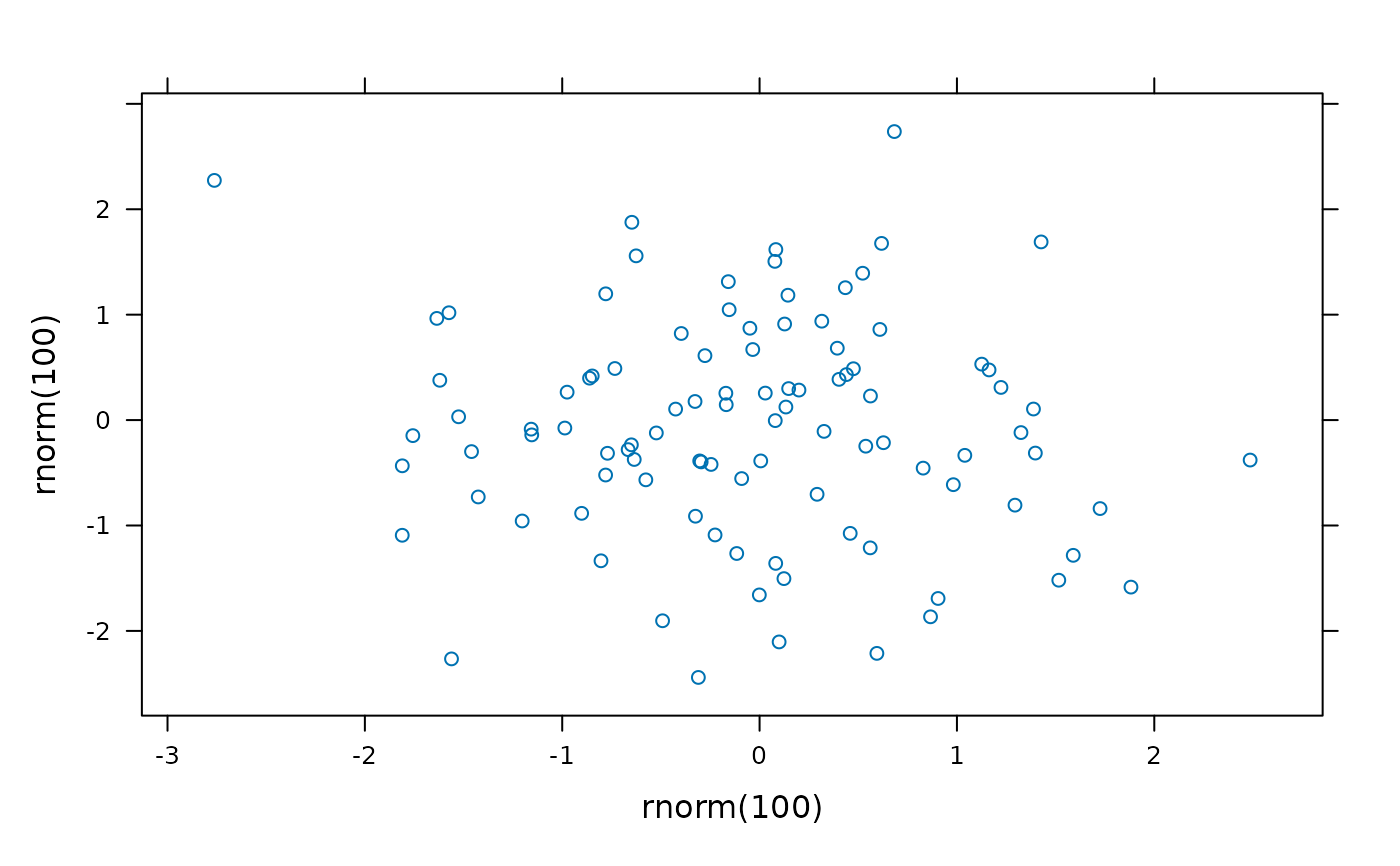
p <- xyplot(rnorm(100) ~rnorm(100))
print(p)
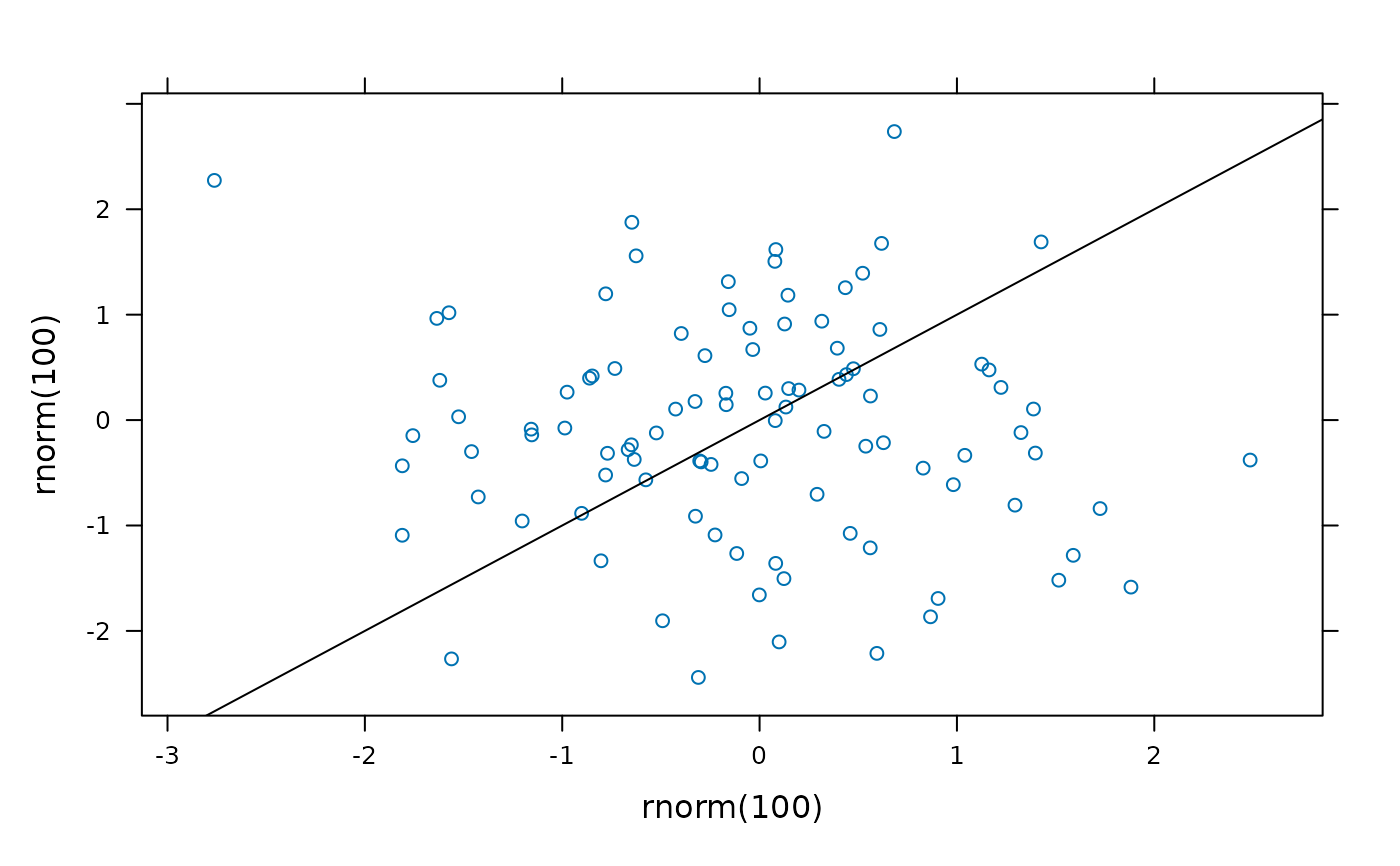
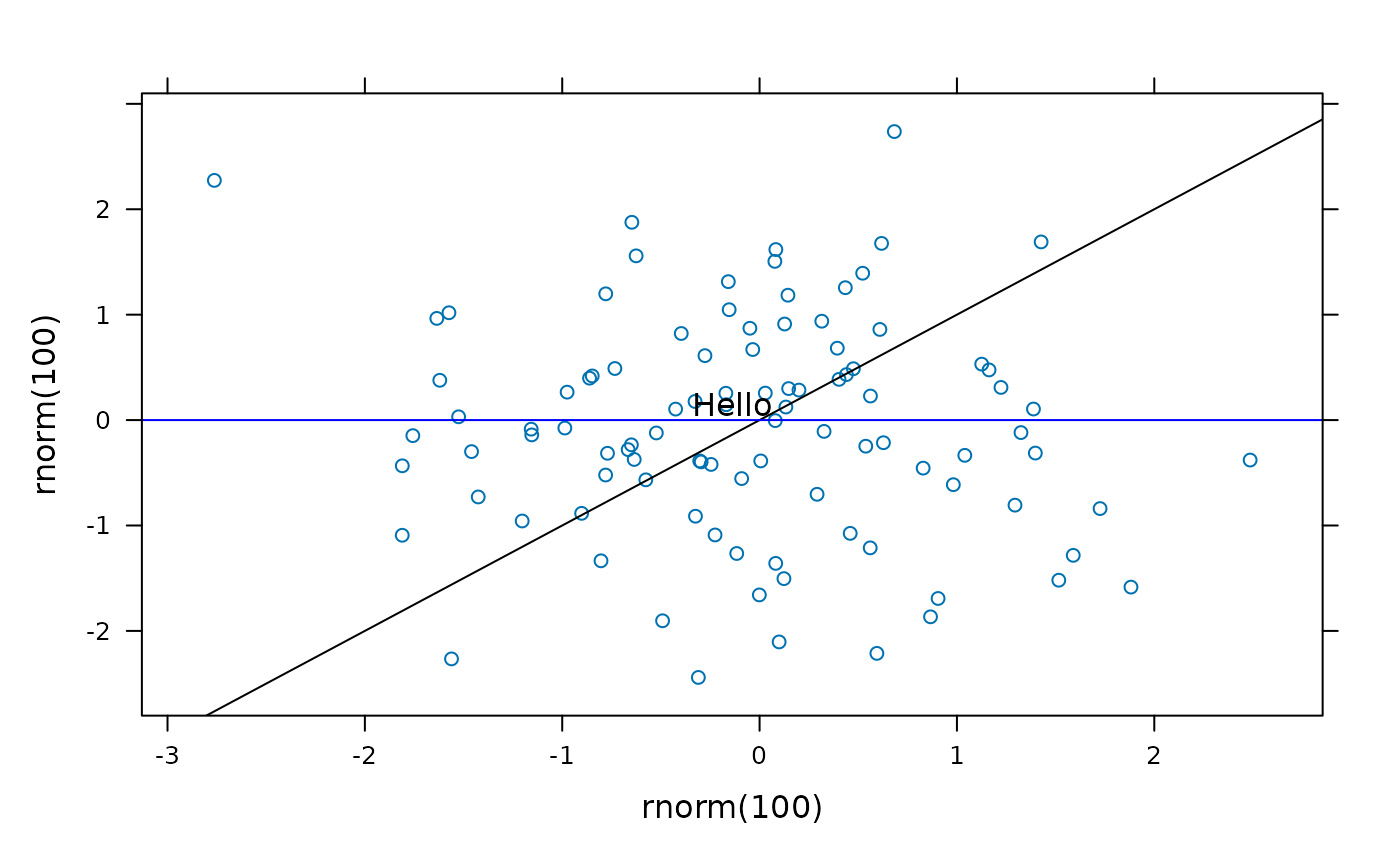
 ladd(panel.abline(a=0,b=1))
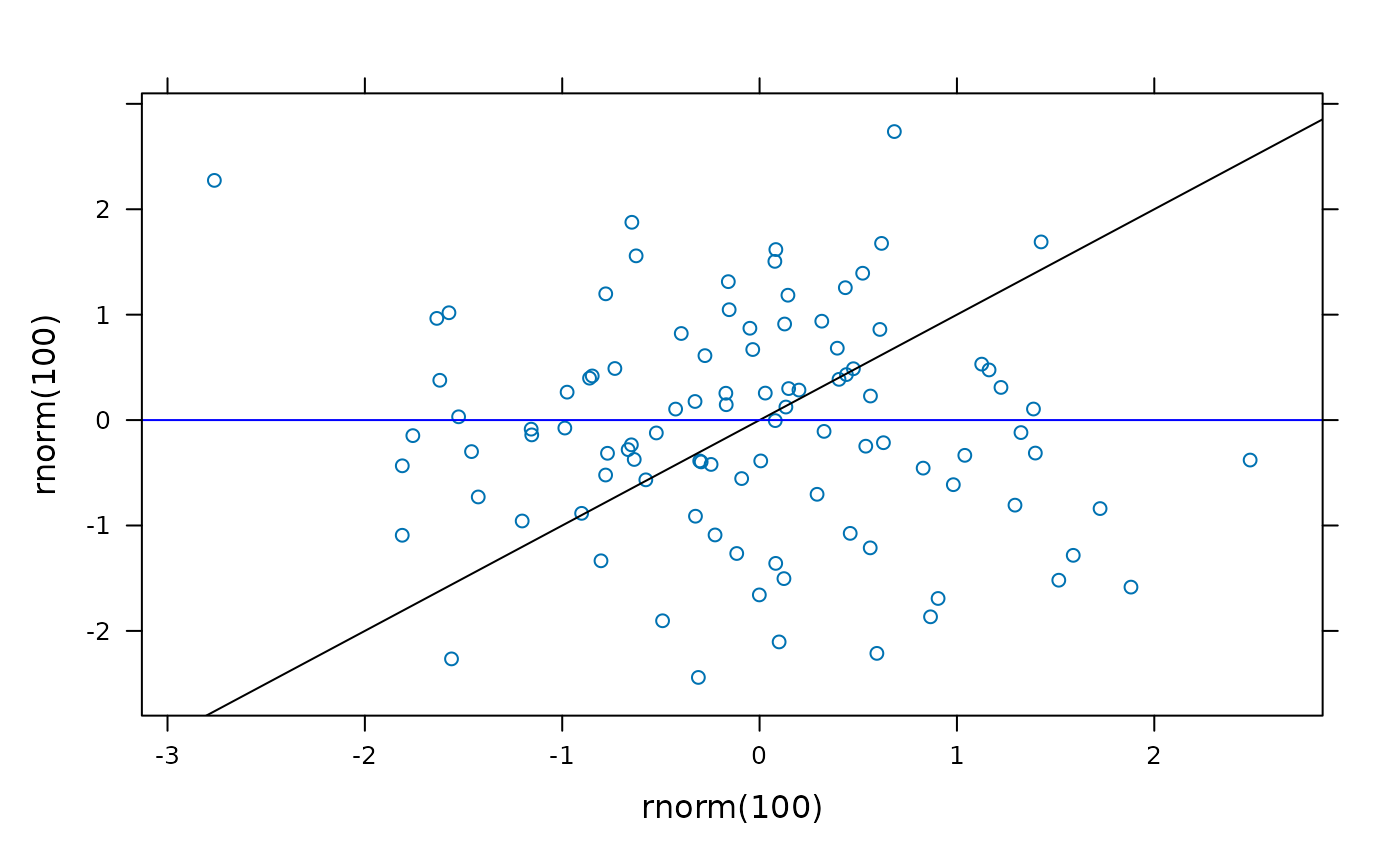
 ladd(panel.abline(h=0,col='blue'))
 ladd(grid.text('Hello'))
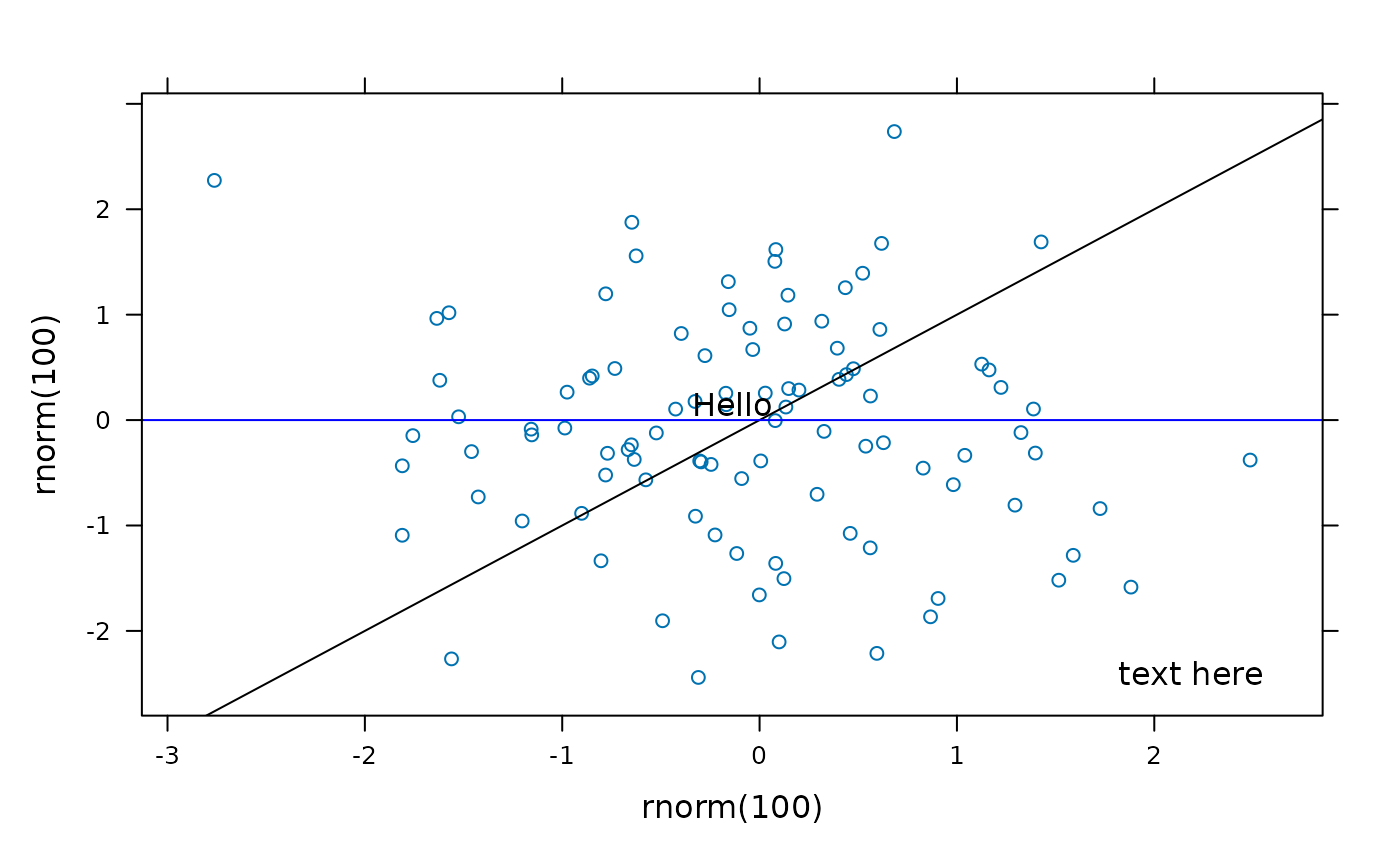
 ladd(grid.text(x=.95,y=.05,'text here',just=c('right','bottom')))
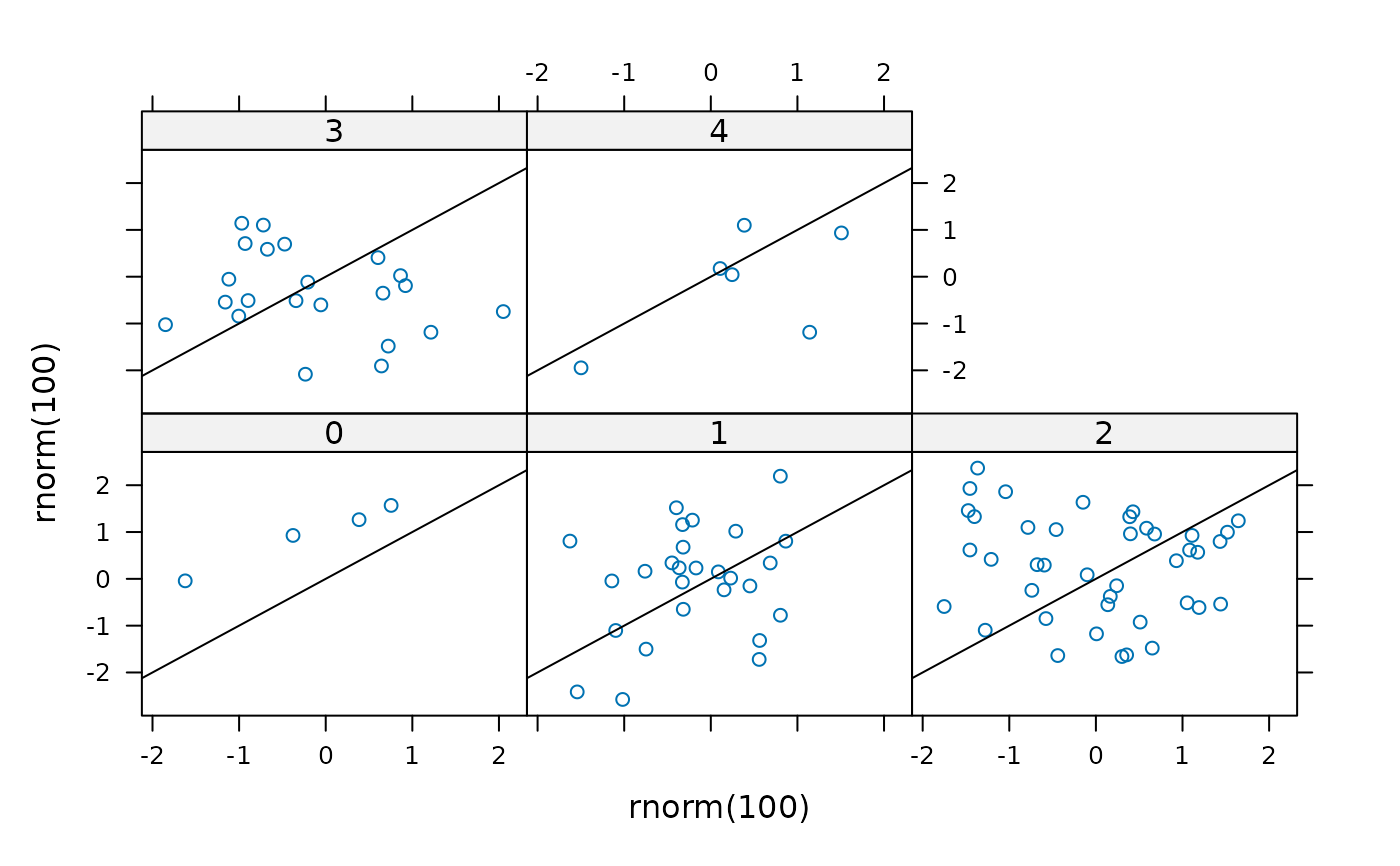
 q <- xyplot(rnorm(100) ~rnorm(100)|factor(rbinom(100,4,.5)))
q <- update(q, layout=c(3,2))
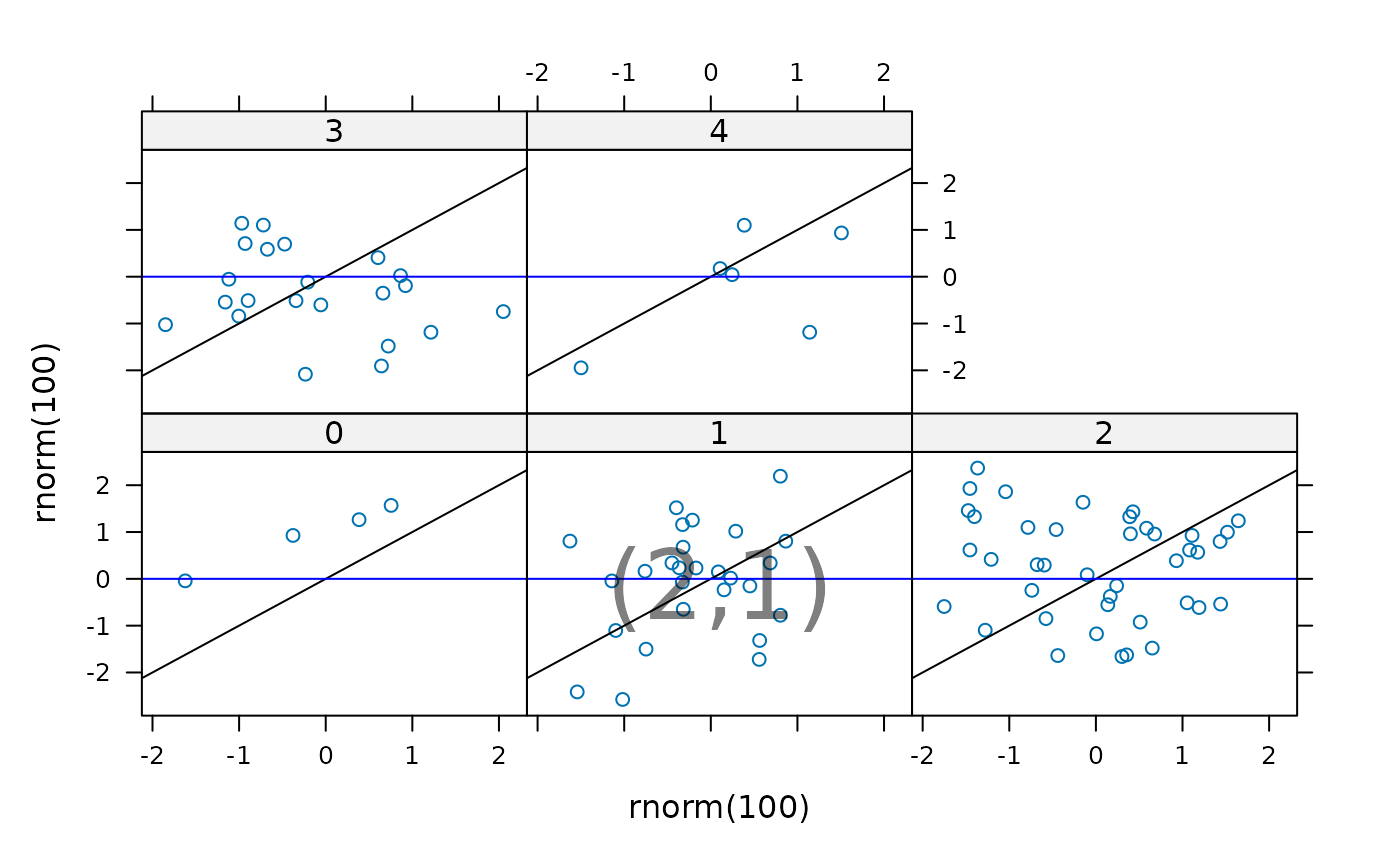
ladd(panel.abline(a=0,b=1), plot=q)
q <- xyplot(rnorm(100) ~rnorm(100)|factor(rbinom(100,4,.5)))
q <- update(q, layout=c(3,2))
ladd(panel.abline(a=0,b=1), plot=q)
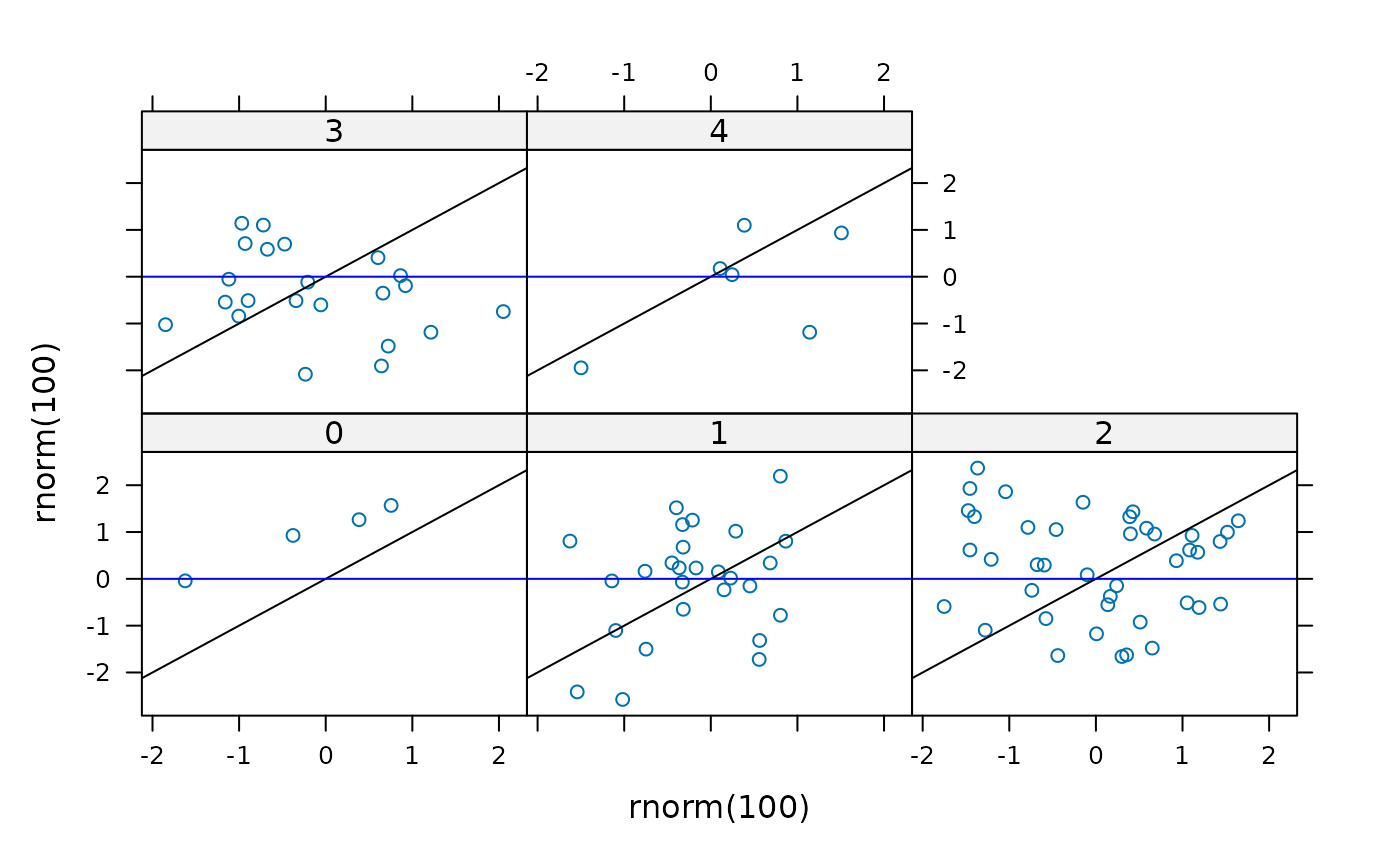
 ladd(panel.abline(h=0,col='blue'))
 ladd( grid.text("(2,1)",gp=gpar(cex=3,alpha=.5)), columns=2, rows=1)
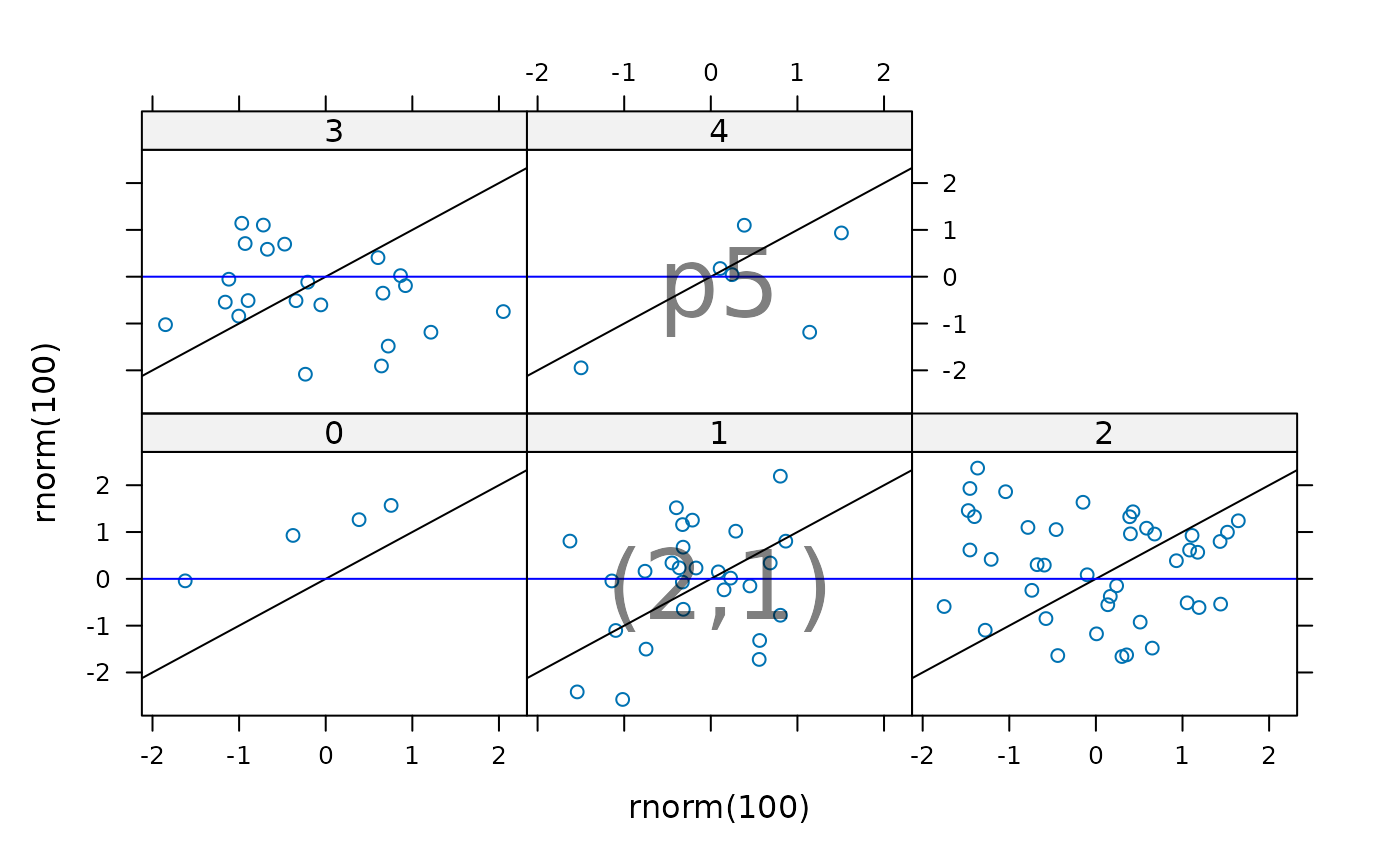
 ladd( grid.text("p5",gp=gpar(cex=3,alpha=.5)), packets=5)
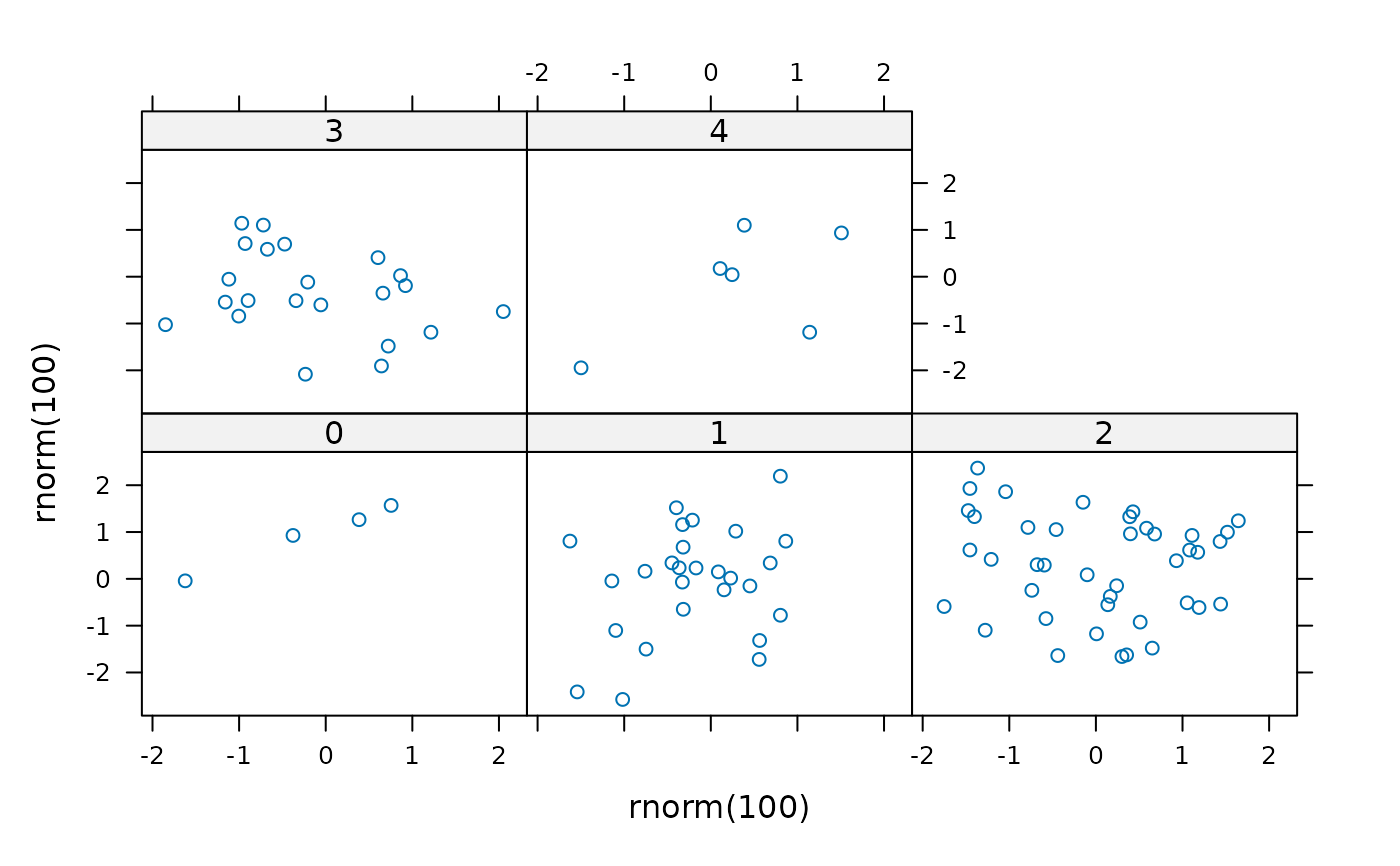
 q
q
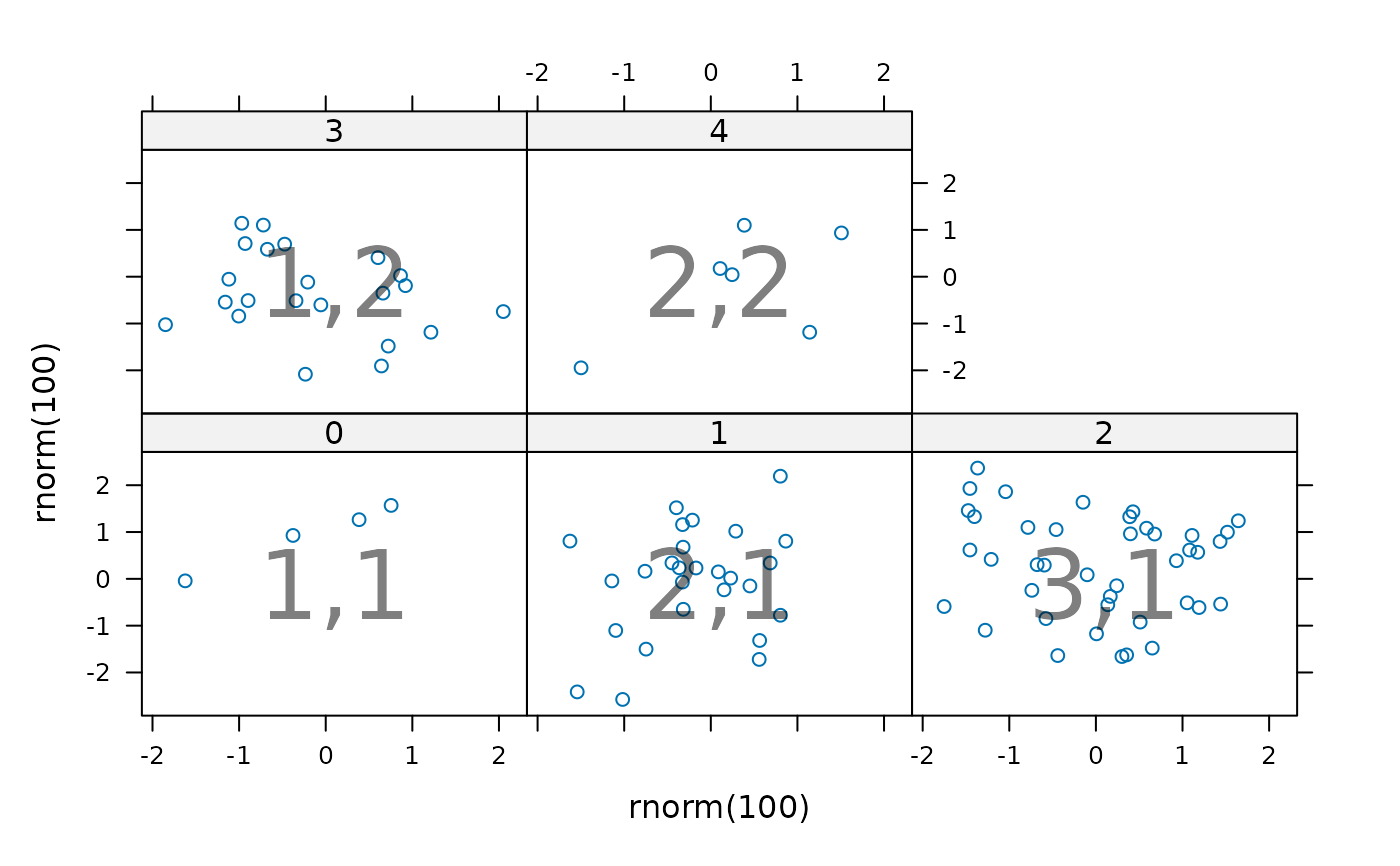
 ladd( grid.text(paste(current.column(), current.row(),sep=','), gp=gpar(cex=3,alpha=.5)) )
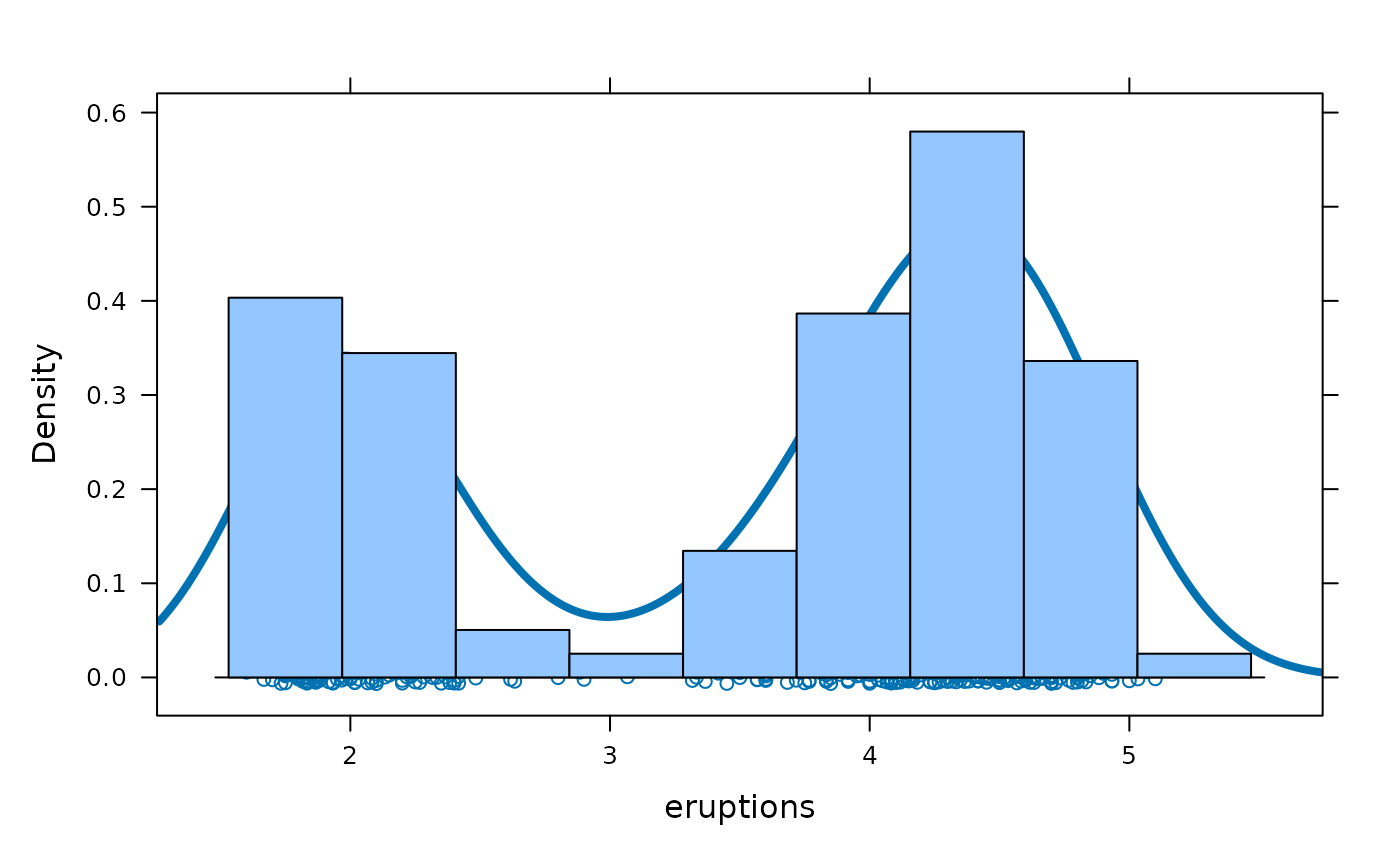
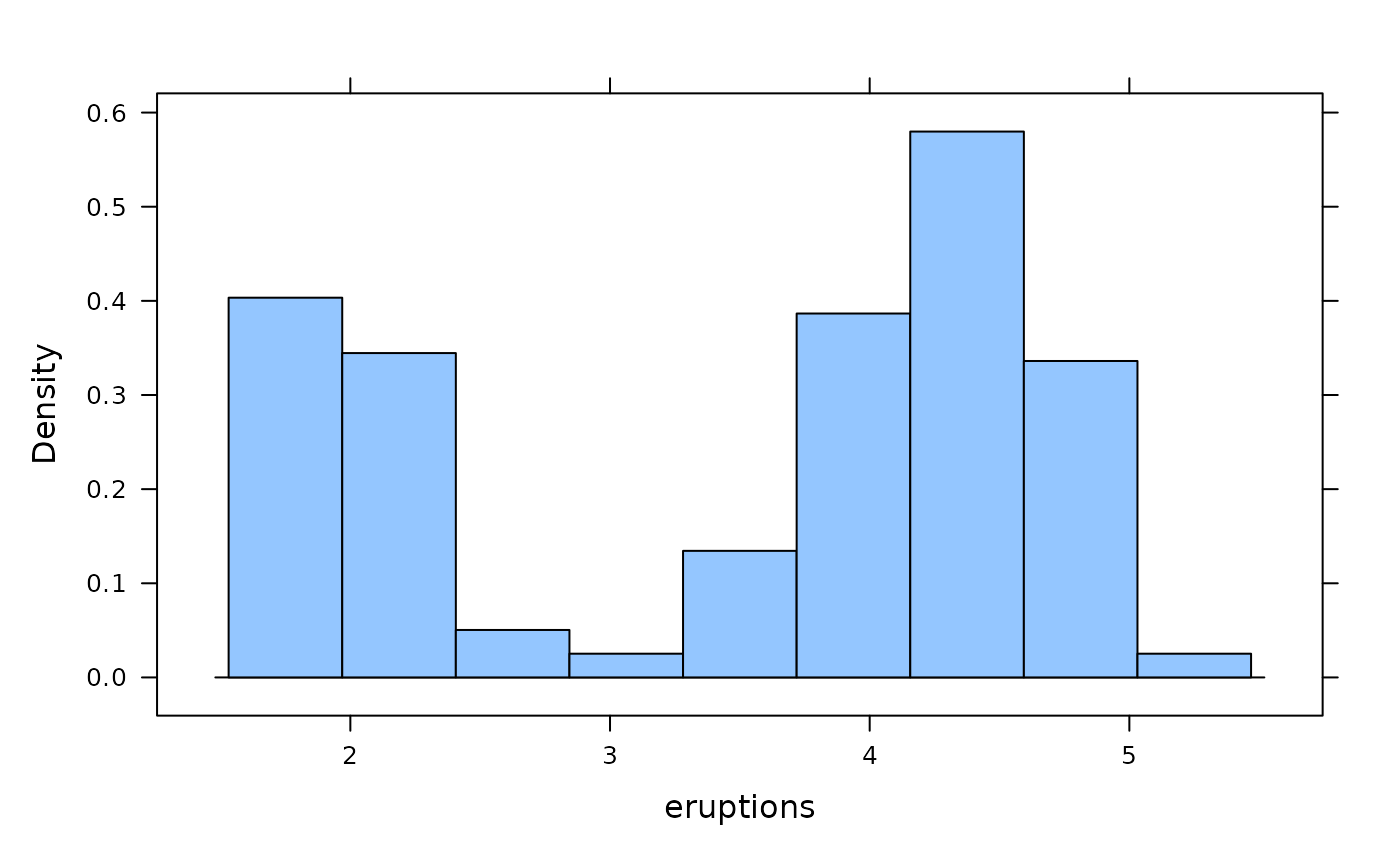
 histogram( ~eruptions, data=faithful )
 # over would probably be better here, but the demonstrates what under=TRUE does.
ladd(panel.densityplot(faithful$eruptions, lwd=4), under=TRUE)
# over would probably be better here, but the demonstrates what under=TRUE does.
ladd(panel.densityplot(faithful$eruptions, lwd=4), under=TRUE)