Scatter Plot Matrices
splom.RdDraw Conditional Scatter Plot Matrices and Parallel Coordinate Plots
Usage
splom(x, data, ...)
parallelplot(x, data, ...)

# S3 method for class 'formula'
splom(x,
      data,
      auto.key = lattice.getOption("default.args")$auto.key,
      aspect = 1,
      between = list(x = 0.5, y = 0.5),
      panel = lattice.getOption("panel.splom"),
      prepanel,
      scales,
      strip,
      groups,
      xlab,
      xlim,
      ylab = NULL,
      ylim,
      superpanel = lattice.getOption("panel.pairs"),
      pscales = 5,
      varnames = NULL,
      drop.unused.levels,
      ...,
      lattice.options = NULL,
      default.scales,
      default.prepanel = lattice.getOption("prepanel.default.splom"),
      subset = TRUE)
# S3 method for class 'formula'
parallelplot(x,
         data,
         auto.key = lattice.getOption("default.args")$auto.key,
         aspect = "fill",
         between = list(x = 0.5, y = 0.5),
         panel = lattice.getOption("panel.parallel"),
         prepanel,
         scales,
         strip,
         groups,
         xlab = NULL,
         xlim,
         ylab = NULL,
         ylim,
         varnames = NULL,
         horizontal.axis = TRUE,
         drop.unused.levels,
         ...,
         lattice.options = NULL,
         default.scales,
         default.prepanel = lattice.getOption("prepanel.default.parallel"),
         subset = TRUE)

# S3 method for class 'data.frame'
splom(x, data = NULL, ..., groups = NULL, subset = TRUE)
# S3 method for class 'matrix'
splom(x, data = NULL, ..., groups = NULL, subset = TRUE)

# S3 method for class 'matrix'
parallelplot(x, data = NULL, ..., groups = NULL, subset = TRUE)
# S3 method for class 'data.frame'
parallelplot(x, data = NULL, ..., groups = NULL, subset = TRUE)
Arguments
- x
The object on which method dispatch is carried out.
For the
"formula"method, a formula describing the structure of the plot, which should be of the form~ x | g1 * g2 * ..., wherexis a data frame or matrix. Each ofg1,g2,...must be either factors or shingles. The conditioning variablesg1, g2, ...may be omitted.For the
data.framemethods, a data frame.- data
For the
formulamethods, an optional data frame in which variables in the formula (as well asgroupsandsubset, if any) are to be evaluated.- aspect
aspect ratio of each panel (and subpanel), square by default for
splom.- between
to avoid confusion between panels and subpanels, the default is to show the panels of a splom plot with space between them.
- panel
For
parallelplot, this has the usual interpretation, i.e., a function that creates the display within each panel.For
splom, the terminology is slightly complicated. The role played by the panel function in most other high-level functions is played here by thesuperpanelfunction, which is responsible for the display for each conditional data subset.panelis simply an argument to the defaultsuperpanelfunctionpanel.pairs, and is passed on to it unchanged. It is used there to create each pairwise display. Seepanel.pairsfor more useful options.- superpanel
function that sets up the splom display, by default as a scatterplot matrix.
- pscales
a numeric value or a list, meant to be a less functional substitute for the
scalesargument inxyplotetc. This argument is passed to thesuperpanelfunction, and is handled by the default superpanel functionpanel.pairs. The help page for the latter documents this argument in more detail.- varnames
A character or expression vector or giving names to be used for the variables in
x. By default, the column names ofx.- horizontal.axis
logical indicating whether the parallel axes should be laid out horizontally (
TRUE) or vertically (FALSE).- auto.key, prepanel, scales, strip, groups, xlab, xlim, ylab, ylim, drop.unused.levels, lattice.options, default.scales, subset
See
xyplot- default.prepanel
Fallback prepanel function. See
xyplot.- ...
Further arguments. See corresponding entry in
xyplotfor non-trivial details.
Details
splom produces Scatter Plot Matrices. The role usually played
by panel is taken over by superpanel, which takes a data
frame subset and is responsible for plotting it. It is called with
the coordinate system set up to have both x- and y-limits from
0.5 to ncol(z) + 0.5. The only built-in option
currently available is panel.pairs, which calls a
further panel function for each pair (i, j) of variables in
z inside a rectangle of unit width and height centered at
c(i, j) (see panel.pairs for details).
Many of the finer customizations usually done via arguments to high
level function like xyplot are instead done by
panel.pairs for splom. These include control of axis
limits, tick locations and prepanel calcultions. If you are trying to
fine-tune your splom plot, definitely look at the
panel.pairs help page. The scales argument is
usually not very useful in splom, and trying to change it may
have undesired effects.
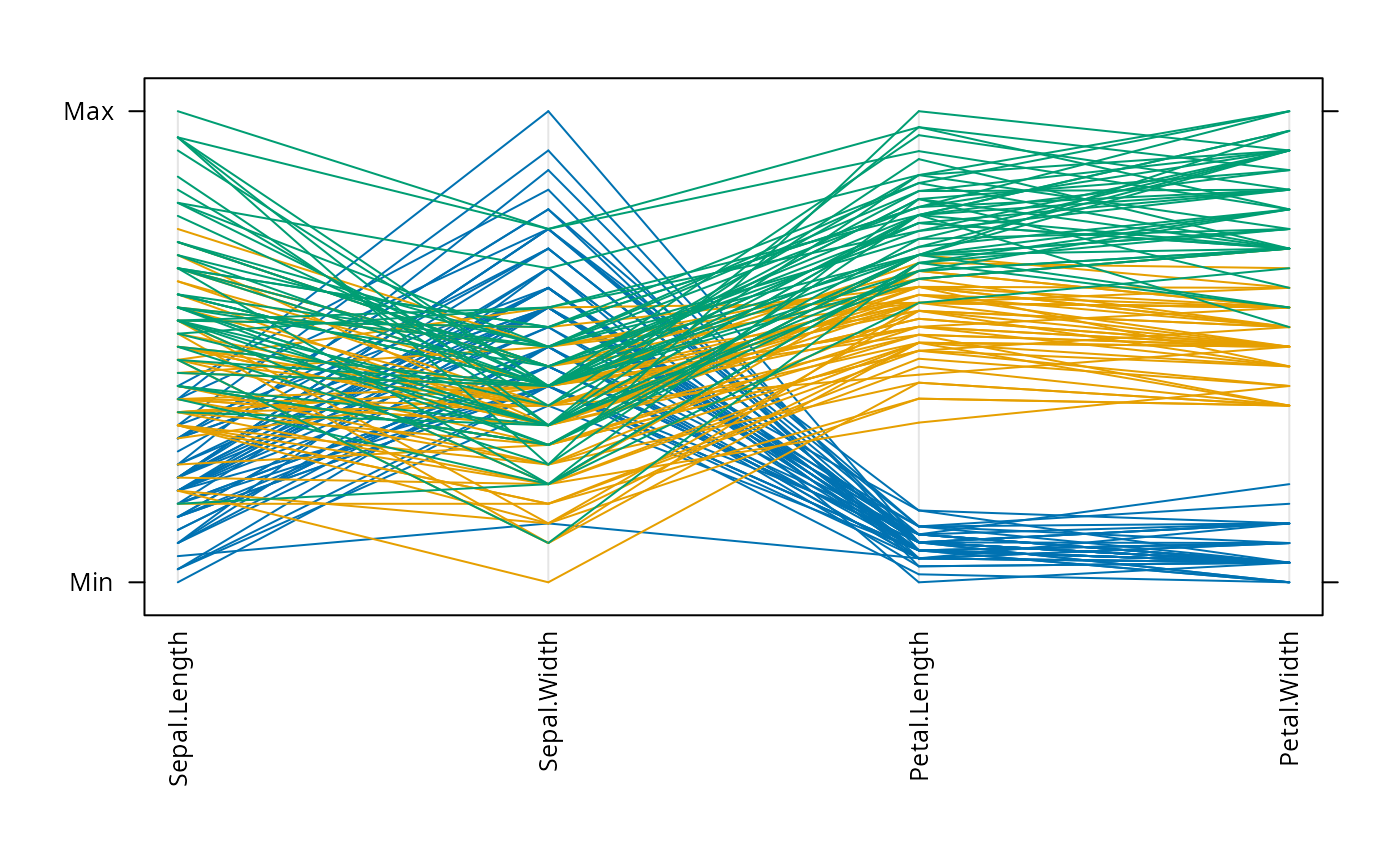
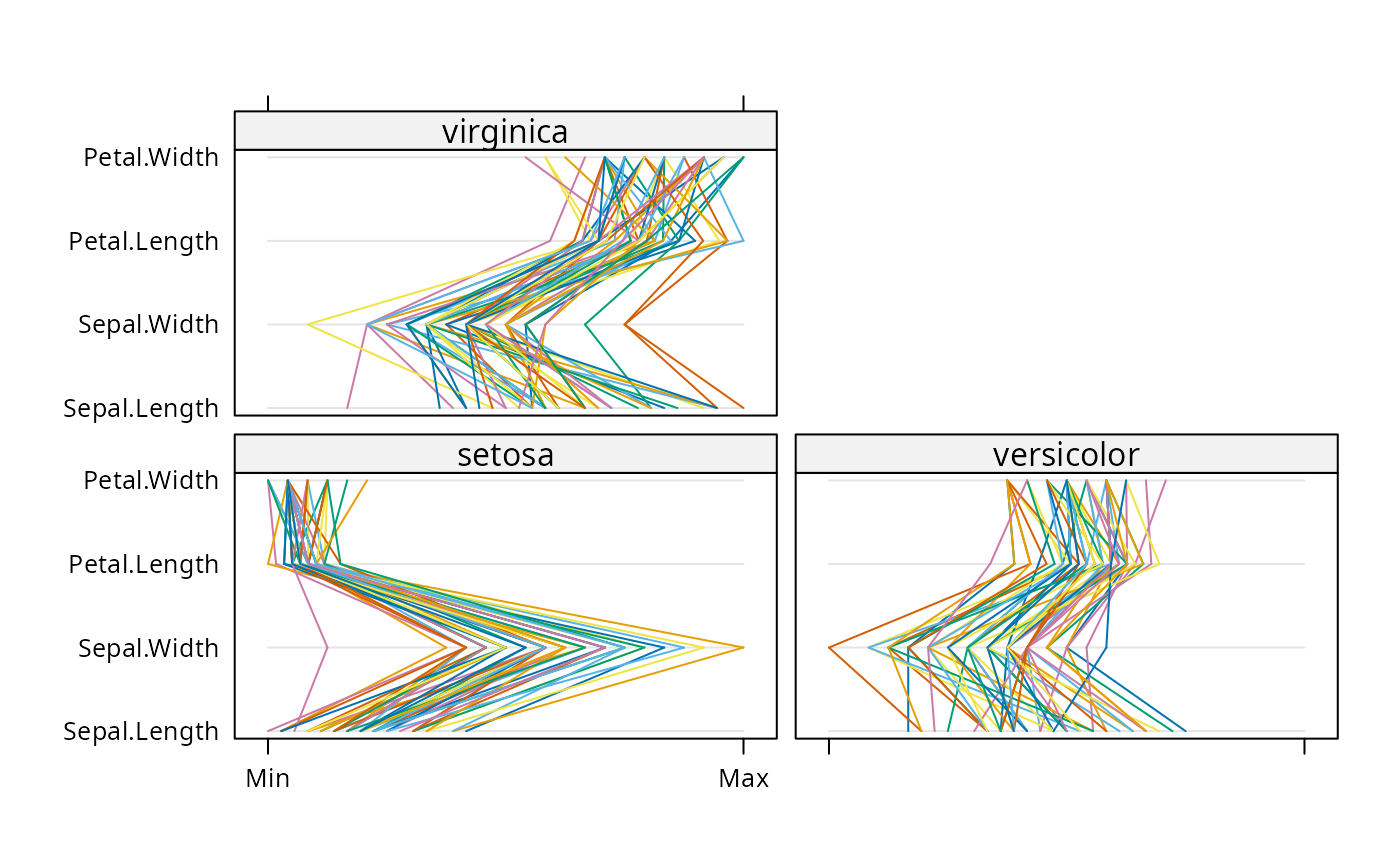
parallelplot draws Parallel Coordinate Plots. (Difficult to
describe, see example.)
These and all other high level Trellis functions have several
arguments in common. These are extensively documented only in the
help page for xyplot, which should be consulted to learn more
detailed usage.
Value
An object of class "trellis". The
update method can be used to
update components of the object and the
print method (usually called by
default) will plot it on an appropriate plotting device.
Author
Deepayan Sarkar Deepayan.Sarkar@R-project.org
Examples
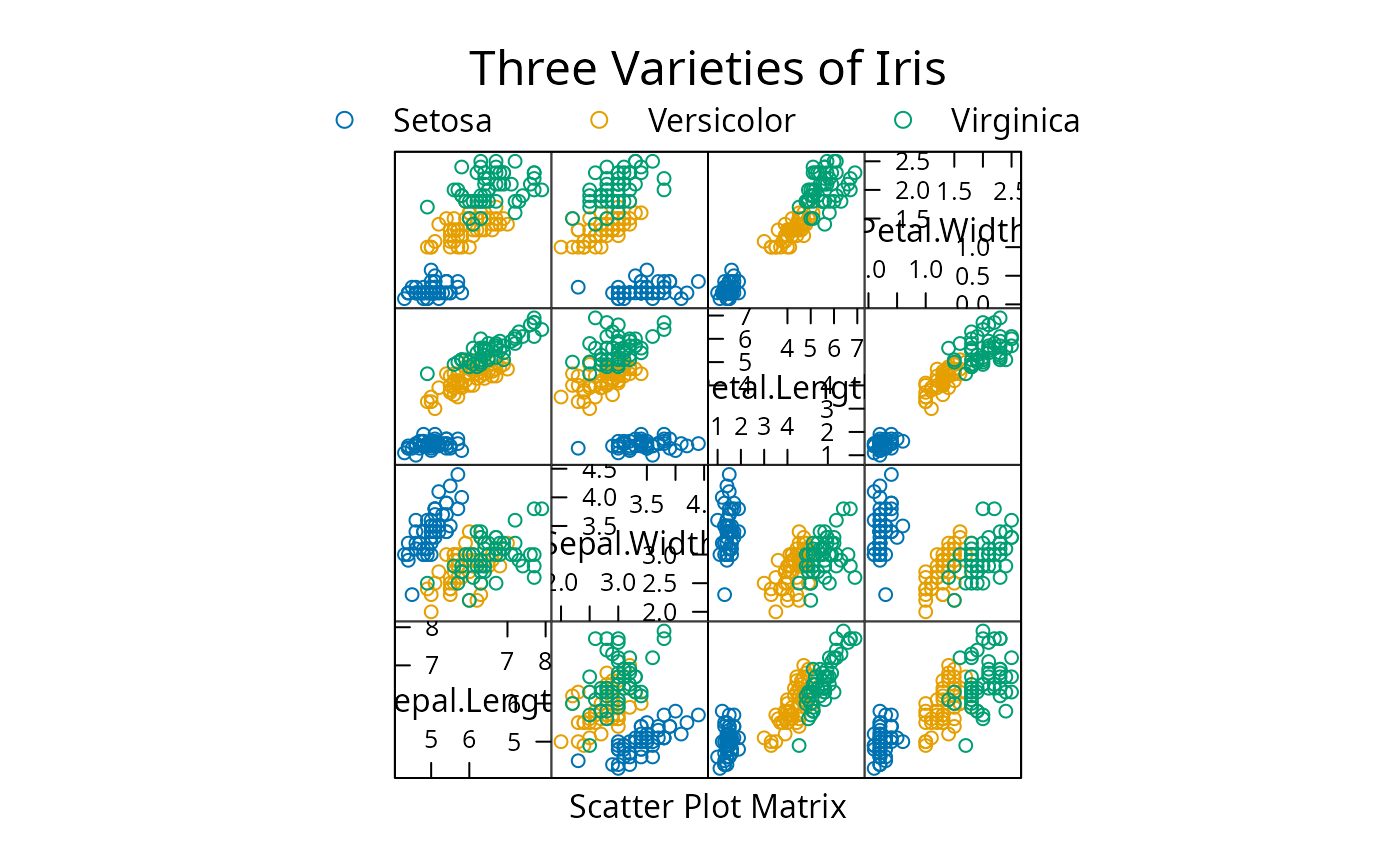
super.sym <- trellis.par.get("superpose.symbol")
splom(~iris[1:4], groups = Species, data = iris,
panel = panel.superpose,
key = list(title = "Three Varieties of Iris",
columns = 3,
points = list(pch = super.sym$pch[1:3],
col = super.sym$col[1:3]),
text = list(c("Setosa", "Versicolor", "Virginica"))))
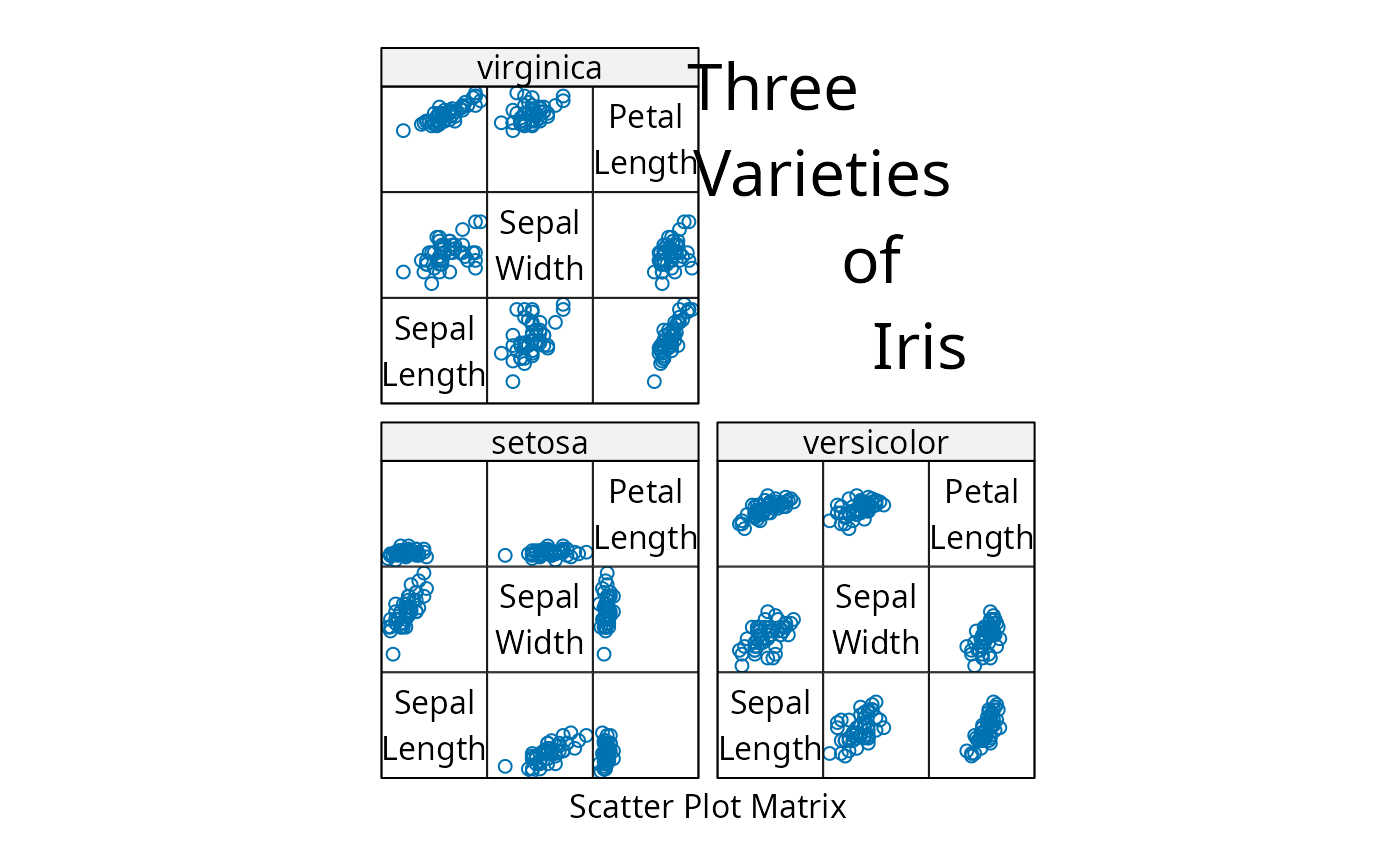
 splom(~iris[1:3]|Species, data = iris,
layout=c(2,2), pscales = 0,
varnames = c("Sepal\nLength", "Sepal\nWidth", "Petal\nLength"),
page = function(...) {
ltext(x = seq(.6, .8, length.out = 4),
y = seq(.9, .6, length.out = 4),
labels = c("Three", "Varieties", "of", "Iris"),
cex = 2)
})
splom(~iris[1:3]|Species, data = iris,
layout=c(2,2), pscales = 0,
varnames = c("Sepal\nLength", "Sepal\nWidth", "Petal\nLength"),
page = function(...) {
ltext(x = seq(.6, .8, length.out = 4),
y = seq(.9, .6, length.out = 4),
labels = c("Three", "Varieties", "of", "Iris"),
cex = 2)
})
 parallelplot(~iris[1:4] | Species, iris)
 parallelplot(~iris[1:4], iris, groups = Species,
horizontal.axis = FALSE, scales = list(x = list(rot = 90)))
parallelplot(~iris[1:4], iris, groups = Species,
horizontal.axis = FALSE, scales = list(x = list(rot = 90)))