Default Superpanel Function for splom
panel.pairs.RdThis is the default superpanel function for splom.
Usage
panel.pairs(z,
            panel = lattice.getOption("panel.splom"),
            lower.panel = panel,
            upper.panel = panel,
            diag.panel = "diag.panel.splom",
            as.matrix = FALSE,
            groups = NULL,
            panel.subscripts,
            subscripts,
            pscales = 5,
            prepanel.limits = scale_limits,
            varnames = colnames(z),
            varname.col, varname.cex, varname.font,
            varname.fontfamily, varname.fontface,
            axis.text.col, axis.text.cex, axis.text.font,
            axis.text.fontfamily, axis.text.fontface,
            axis.text.lineheight,
            axis.line.col, axis.line.lty, axis.line.lwd,
            axis.line.alpha, axis.line.tck,
            ...)
diag.panel.splom(x = NULL,
                 varname = NULL, limits, at = NULL, labels = NULL,
                 draw = TRUE, tick.number = 5,
                 varname.col, varname.cex,
                 varname.lineheight, varname.font,
                 varname.fontfamily, varname.fontface,
                 axis.text.col, axis.text.alpha,
                 axis.text.cex, axis.text.font,
                 axis.text.fontfamily, axis.text.fontface,
                 axis.text.lineheight,
                 axis.line.col, axis.line.alpha,
                 axis.line.lty, axis.line.lwd,
                 axis.line.tck,
                 ...)
Arguments
- z
The data frame used for the plot.
- panel, lower.panel, upper.panel
The panel function used to display each pair of variables. If specified,
lower.panelandupper.panelare used for panels below and above the diagonal respectively.In addition to extra arguments not recognized by
panel.pairs, the list of arguments passed to the panel function also includes arguments namediandj, with values indicating the row and column of the scatterplot matrix being plotted.- diag.panel
The panel function used for the diagonals. See arguments to
diag.panel.splomto know what arguments this function is passed when called. Usediag.panel=NULLto suppress plotting on the diagonal panels.- as.matrix
logical. If
TRUE, the layout of the panels will have origin on the top left instead of bottom left (similar topairs). This is in essence the same functionality as provided byas.tablefor the panel layout- groups
Grouping variable, if any
- panel.subscripts
logical specifying whether the panel function accepts an argument named
subscripts.- subscripts
The indices of the rows of
zthat are to be displayed in this (super)panel.- pscales
Controls axis labels, passed down from
splom. Ifpscalesis a single number, it indicates the approximate number of equally-spaced ticks that should appear on each axis. Ifpscalesis a list, it should have one component for each column inz, each of which itself a list with the following valid components:at: a numeric vector specifying tick locationslabels: character vector labels to go with atlimits: numeric 2-vector specifying axis limits (should be made more flexible at some point to handle factors)These are specifications on a per-variable basis, and used on all four sides in the diagonal cells used for labelling. Factor variables are labelled with the factor names. Use
pscales=0to supress the axes entirely.- prepanel.limits
A function to calculate suitable axis limits given a single argument
xcontaining a data vector. The return value of the function should be similar to thexlimorylimargument documented inxyplot; that is, it should be a numeric or DateTime vector of length 2 defining a range, or a character vector representing levels of a factor.Most high-level lattice plots (such as
xyplot) use theprepanelfunction for deciding on axis limits from data. This function serves a similar function by calculating the per-variable limits. These limits can be overridden by the correspondinglimitscomponent in thepscaleslist.- x
data vector corresponding to that row / column (which will be the same for diagonal ‘panels’).
- varname
(scalar) character string or expression that is to be written centred within the panel
- limits
numeric of length 2, or, vector of characters, specifying the scale for that panel (used to calculate tick locations when missing)
- at
locations of tick marks
- labels
optional labels for tick marks
- draw
A logical flag specifying whether to draw the tick marks and labels. If
FALSE, variable names are shown but axis annotation is omitted.- tick.number
A Numeric scalar giving the suggested number of tick marks.
- varnames
A character or expression vector or giving names to be used for the variables in
x. By default, the column names ofx.- varname.col
Color for the variable name in each diagonal panel. See
gparfor details on this and the other graphical parameters listed below.- varname.cex
Size multiplier for the variable name in each diagonal panel.
- varname.lineheight
Line height for the variable name in each diagonal panel.
- varname.font, varname.fontfamily, varname.fontface
Font specification for the variable name in each diagonal panel.
- axis.text.col
Color for axis label text.
- axis.text.cex
Size multiplier for axis label text.
- axis.text.font, axis.text.fontfamily, axis.text.fontface
Font specification for axis label text.
- axis.text.lineheight
Line height for axis label text.
- axis.text.alpha
Alpha-transparency for axis label text.
- axis.line.col
Color for the axes.
- axis.line.lty
Line type for the axes.
- axis.line.lwd
Line width for the axes.
- axis.line.alpha
Alpha-transparency for the axes.
- axis.line.tck
A numeric multiplier for the length of tick marks in diagonal panels.
- ...
Further arguments, passed on to
panel,lower.panel,upper.panel, anddiag.panelfrompanel.pairs. Currently ignored bydiag.panel.splom.
Details
panel.pairs is the function that is actually used as the panel
function in a "trellis" object produced by splom.
Author
Deepayan Sarkar Deepayan.Sarkar@R-project.org
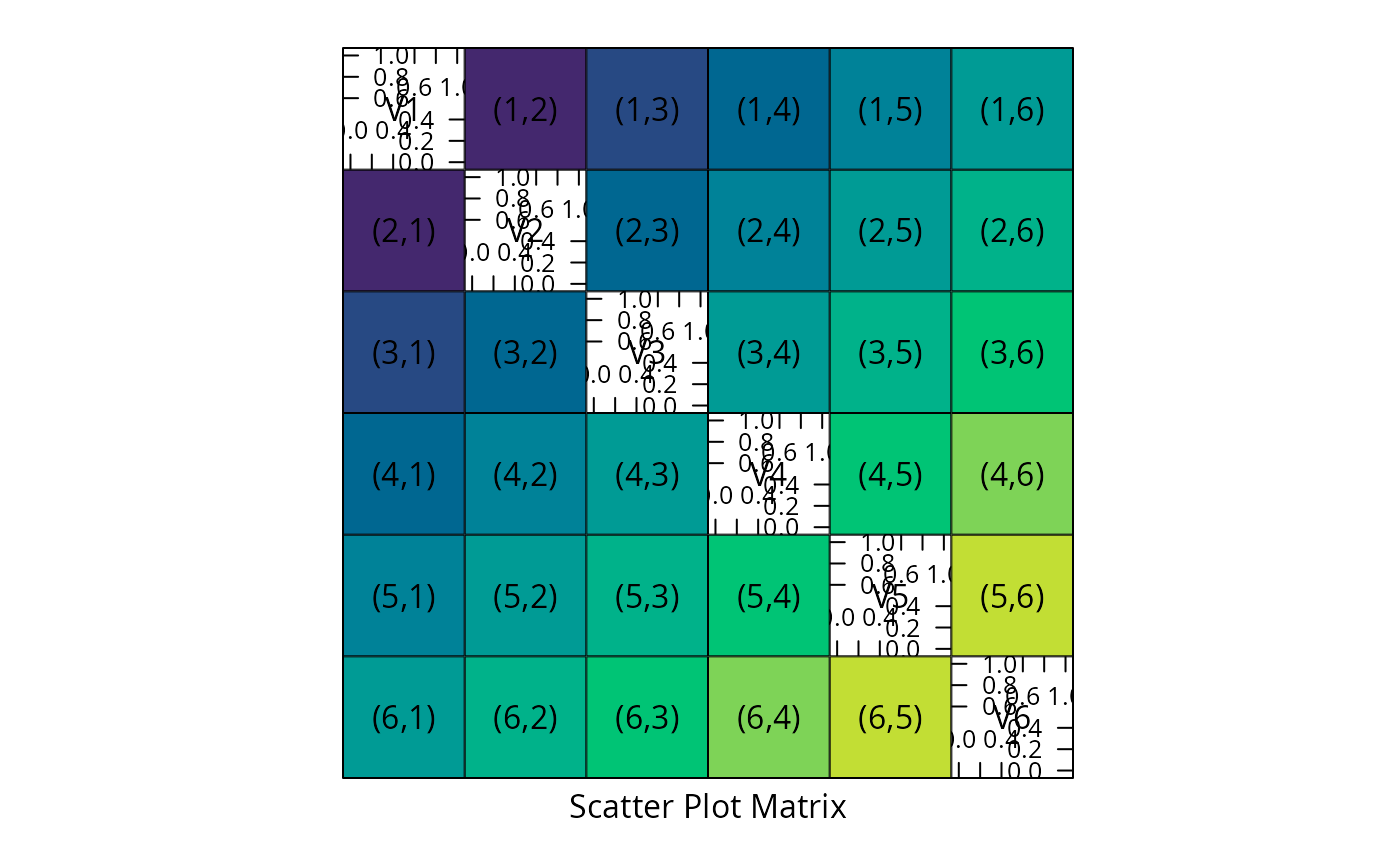
Examples
Cmat <- outer(1:6,1:6,
              function(i,j) hcl.colors(11)[i+j-1]) ## rainbow(11, start=.12, end=.5)[i+j-1])

splom(~diag(6), as.matrix = TRUE,
      panel = function(x, y, i, j, ...) {
          panel.fill(Cmat[i,j])
          panel.text(.5,.5, paste("(",i,",",j,")",sep=""))
      })