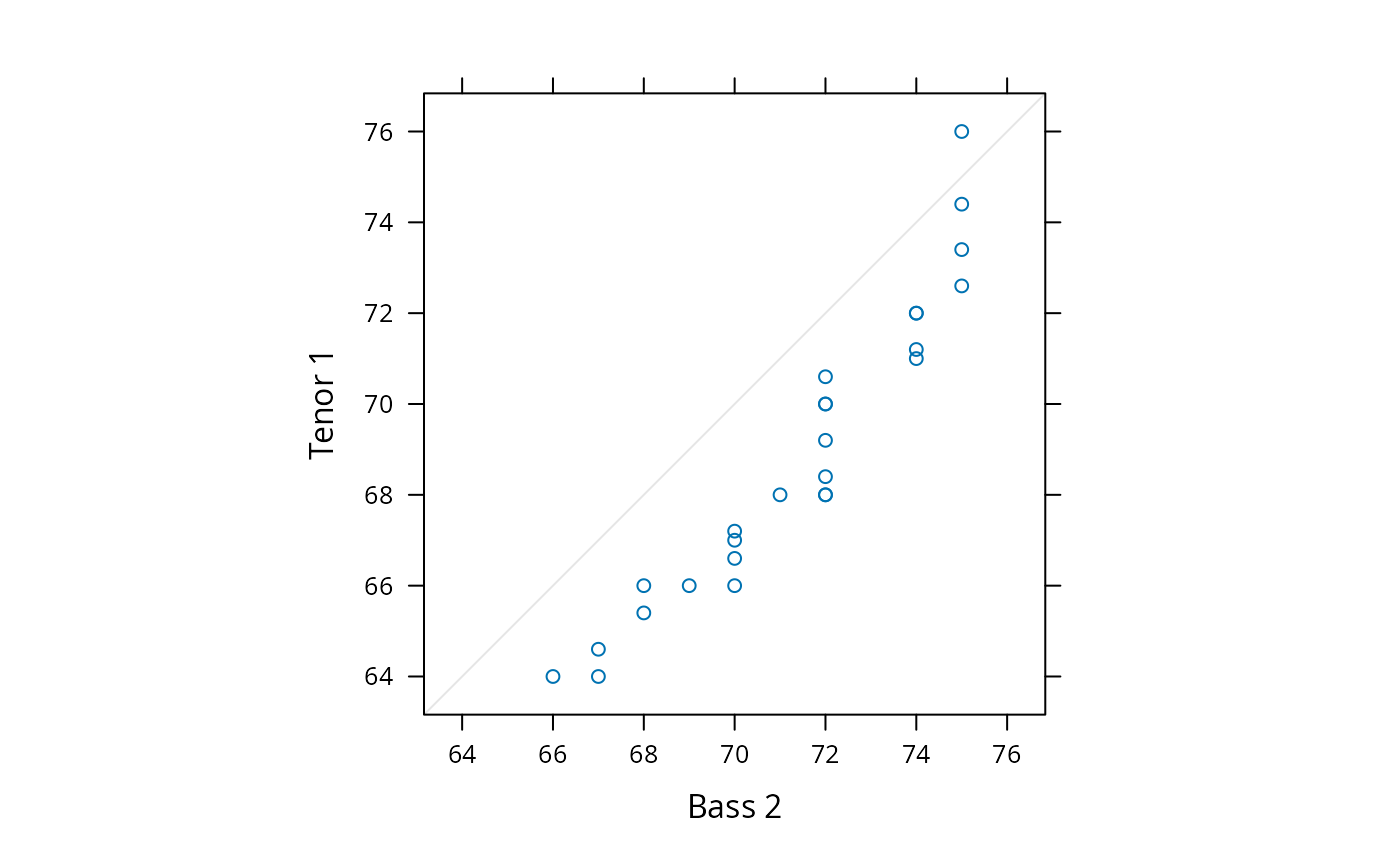
Quantile-Quantile Plots of Two Samples
qq.RdQuantile-Quantile plots for comparing two Distributions
Usage
qq(x, data, ...)

# S3 method for class 'formula'
qq(x, data, aspect = "fill",
   panel = lattice.getOption("panel.qq"),
   prepanel, scales, strip,
   groups, xlab, xlim, ylab, ylim, f.value = NULL,
   drop.unused.levels = lattice.getOption("drop.unused.levels"),
   ...,
   lattice.options = NULL,
   qtype = 7,
   default.scales = list(),
   default.prepanel = lattice.getOption("prepanel.default.qq"),
   subscripts,
   subset)

# S3 method for class 'data.frame'
qq(x, data = NULL, formula = data, ...)
Arguments
- x
The object on which method dispatch is carried out.
For the
"formula"method,xshould be a formula of the formy ~ x | g1 * g2 * ..., wherexshould be a numeric variable, andya factor, shingle, character, or numeric variable, with the restriction that there must be exactly two levels ofy, which divide the values ofxinto two groups. Quantiles for these groups will be plotted against each other along the two axes.- data
-
For the
formulamethod, an optional data source (usually a data frame) in which variables are to be evaluated (seexyplotfor details). - formula
The formula to be used for the
"data.frame"method. See documentation for argumentxfor details.- f.value
-
An optional numeric vector of probabilities, quantiles corresponding to which should be plotted. This can also be a function of a single integer (representing sample size) that returns such a numeric vector. A typical value for this argument is the function
ppoints, which is also the S-PLUS default. If specified, the probabilities generated by this function is used for the plotted quantiles, through thequantilefunction.f.valuedefaults toNULL, which is equivalent tof.value = function(n) ppoints(n, a = 1)This has the effect of including the minimum and maximum data values in the computed quantiles. This is similar to what happens for
qqplotbut different from the default behaviour ofqqin S-PLUS.For large
x, this argument can be used to restrict the number of quantiles plotted. - panel
-
A function, called once for each panel, that uses the packet (subset of panel variables) corresponding to the panel to create a display. The default panel function
panel.qqis documented separately, and has arguments that can be used to customize its output in various ways. Such arguments can usually be directly supplied to the high-level function. - qtype
The
typeargument forquantile.- aspect
See
xyplot.- prepanel
See
xyplot.- scales
See
xyplot.- strip
See
xyplot.- groups
See
xyplot.- xlab, ylab
See
xyplot.- xlim, ylim
See
xyplot.- drop.unused.levels
See
xyplot.- lattice.options
See
xyplot.- default.scales
See
xyplot.- subscripts
See
xyplot.- subset
See
xyplot.- default.prepanel
Fallback prepanel function. See
xyplot.- ...
Further arguments. See corresponding entry in
xyplotfor non-trivial details.
Value
An object of class "trellis". The
update method can be used to
update components of the object and the
print method (usually called by
default) will plot it on an appropriate plotting device.
Author
Deepayan Sarkar Deepayan.Sarkar@R-project.org
Details
qq produces Q-Q plots of two samples. The default behaviour of
qq is different from the corresponding S-PLUS function. See the
entry for f.value for specifics.
This and all other high level Trellis functions have several
arguments in common. These are extensively documented only in the
help page for xyplot, which should be consulted to learn more
detailed usage.