Lattice panel function analogous to smoothScatter
panel.smoothScatter.RdThis function allows the user to place smoothScatter plots in
lattice graphics.
Usage
panel.smoothScatter(x, y = NULL,
                    nbin = 64, cuts = 255,
                    bandwidth,
                    col.regions,
                    colramp,
                    nrpoints = 100,
                    transformation = function(x) x^0.25,
                    pch = ".",
                    cex = 1, col="black",
                    range.x,
                    ...,
                    raster = FALSE,
                    subscripts,
                    identifier = "smoothScatter")
Arguments
- x
Numeric vector containing x-values or n by 2 matrix containing x and y values.
- y
Numeric vector containing y-values (optional). The length of
xmust be the same as that ofy.- nbin
Numeric vector of length 1 (for both directions) or 2 (for x and y separately) containing the number of equally spaced grid points for the density estimation.
- cuts
number of cuts defining the color gradient
- bandwidth
Numeric vector: the smoothing bandwidth. If missing, these functions come up with a more or less useful guess. This parameter then gets passed on to the function
bkde2D.- col.regions
character vector of colors, or a function producing such a vector. Defaults to the
colcomponent of theregionssetting of the current theme.- colramp
Function accepting an integer
nas an argument and returningncolors. If missing, the default is derived fromcol.regionswith the following modification: ifcol.regionsis a vector of colors, it is prepended by"white"before being converted into a function usingcolorRampPalette.- nrpoints
Numeric vector of length 1 giving number of points to be superimposed on the density image. The first
nrpointspoints from those areas of lowest regional densities will be plotted. Adding points to the plot allows for the identification of outliers. If all points are to be plotted, choosenrpoints = Inf.- transformation
Function that maps the density scale to the color scale.
- pch, cex
graphical parameters for the
nrpoints“outlying” points shown in the display- range.x
see
bkde2Dfor details.- col
pointscolor parameter- ...
Further arguments that are passed on to
panel.levelplot.- raster
logical; if
TRUE,panel.levelplot.rasteris used, making potentially smaller output files.- subscripts
ignored, but necessary for handling of ... in certain situations. Likely to be removed in future.
- identifier
A character string that is prepended to the names of grobs that are created by this panel function.
Details
This replicates the display part of the smoothScatter
function by replacing standard graphics calls by grid-compatible ones.
Value
The function is called for its side effects, namely the production of the appropriate plots on a graphics device.
Author
Deepayan Sarkar deepayan.sarkar@r-project.org
Examples
ddf <- as.data.frame(matrix(rnorm(40000), ncol = 4) + 1.5 * rnorm(10000))
ddf[, c(2,4)] <- (-ddf[, c(2,4)])
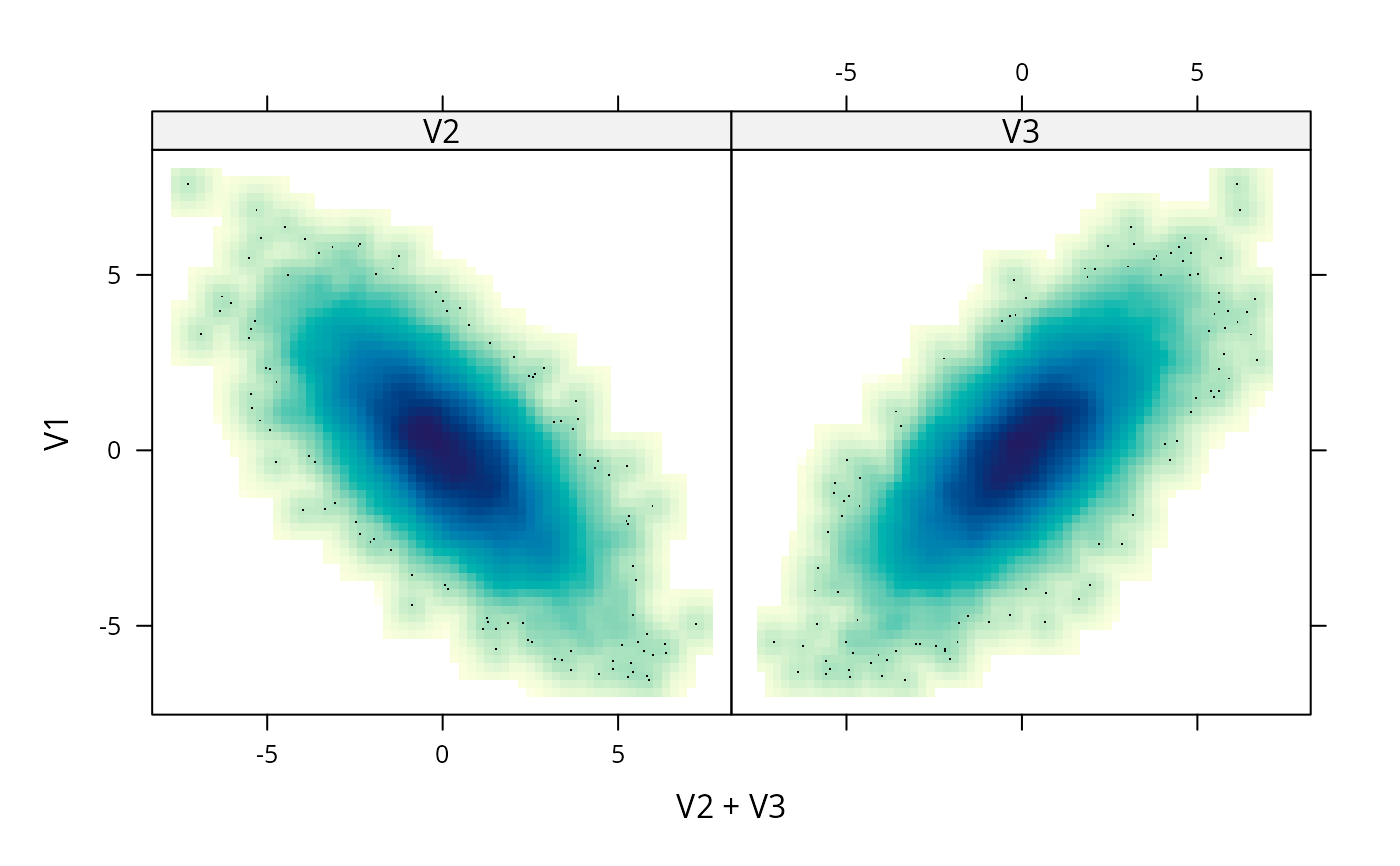
xyplot(V1 ~ V2 + V3, ddf, outer = TRUE,
panel = panel.smoothScatter, aspect = "iso")
#> (loaded the KernSmooth namespace)
 ## argument to panel.levelplot
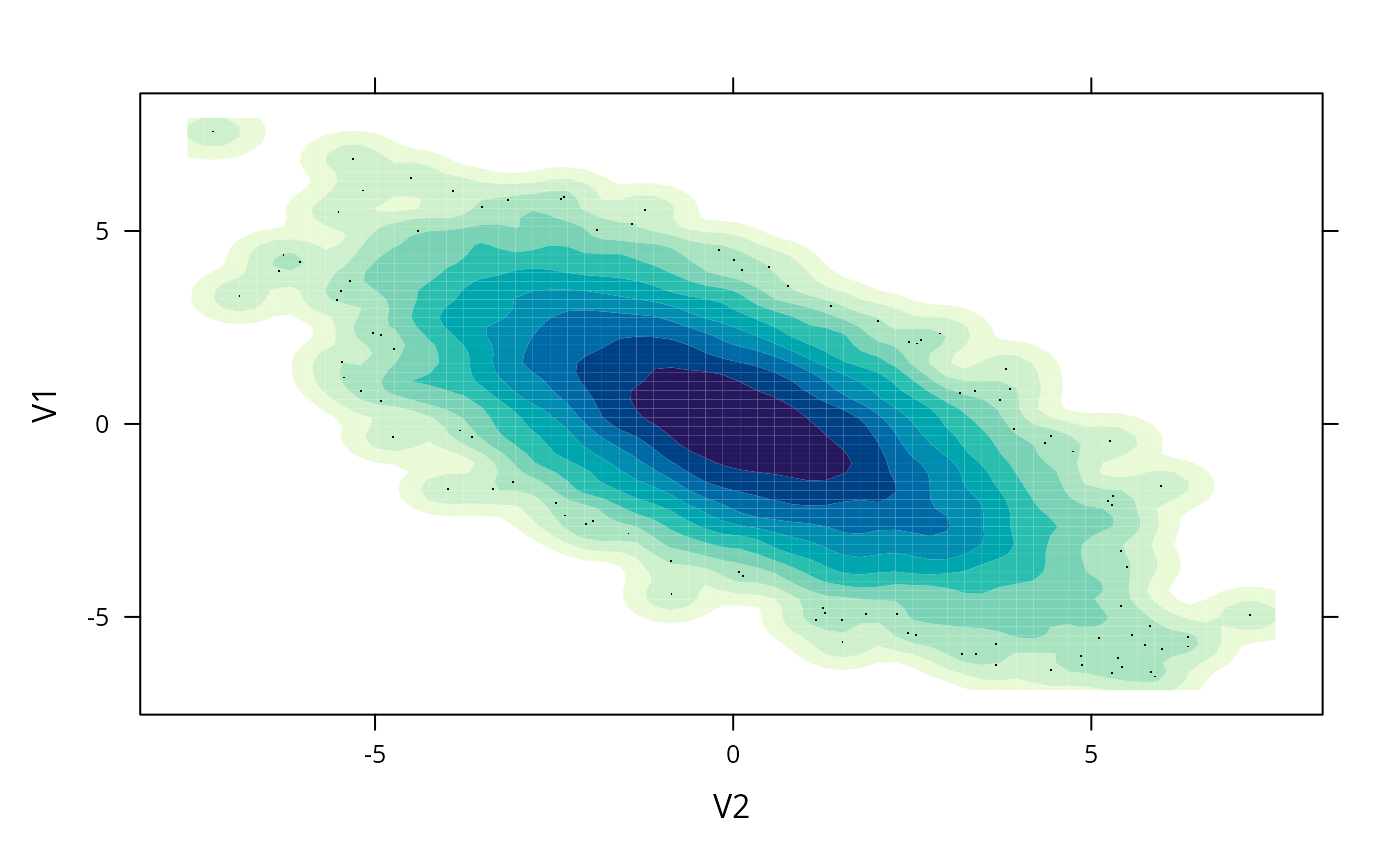
xyplot(V1 ~ V2, ddf, panel = panel.smoothScatter, cuts = 10,
region.type = "contour")
## argument to panel.levelplot
xyplot(V1 ~ V2, ddf, panel = panel.smoothScatter, cuts = 10,
region.type = "contour")
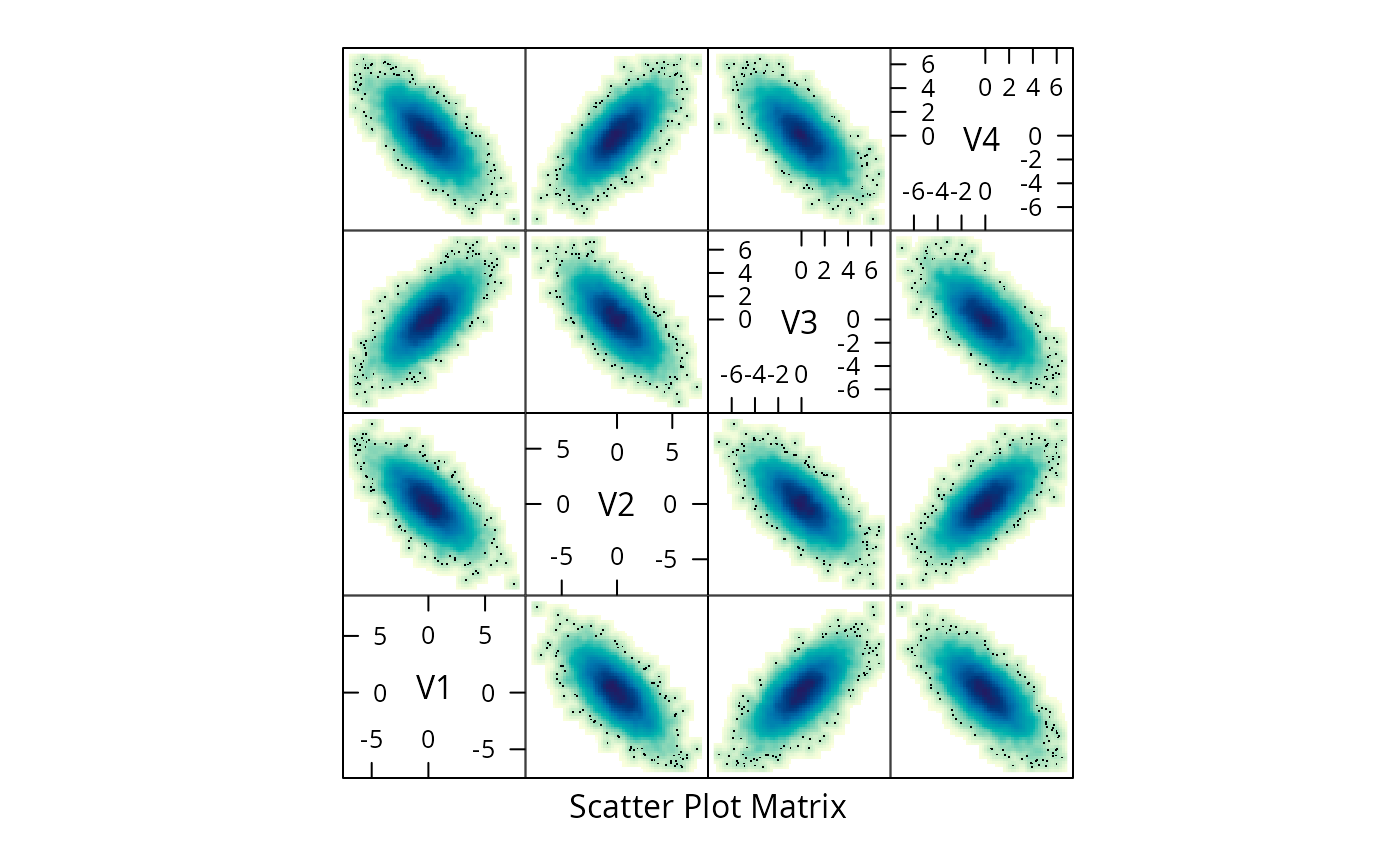
 splom(ddf, panel = panel.smoothScatter, nbin = 64, raster = TRUE)