Panel Functions for levelplot and contourplot
panel.levelplot.RdThese are the default panel functions for levelplot and
contourplot. Also documented is an alternative raster-based
panel function for use with levelplot.
Usage
panel.levelplot(x, y, z,
                subscripts,
                at = pretty(z),
                shrink,
                labels,
                label.style = c("mixed", "flat", "align"),
                contour = FALSE,
                region = TRUE,
                col = add.line$col,
                lty = add.line$lty,
                lwd = add.line$lwd,
                border = "transparent",
                border.lty = 1,
                border.lwd = 0.1,
                ...,
                region.type = c("grid", "contour"),
                col.regions = regions$col,
                alpha.regions = regions$alpha,
                identifier = "levelplot")
panel.contourplot(...)

panel.levelplot.raster(x, y, z,
                       subscripts,
                       at = pretty(z),
                       ...,
                       col.regions = regions$col,
                       alpha.regions = regions$alpha,
                       interpolate = FALSE,
                       identifier = "levelplot")
Arguments
- x, y, z
Variables defining the plot.
- subscripts
Integer vector indicating what subset of
x,yandzto draw.- at
Numeric vector giving breakpoints along the range of
z. Seelevelplotfor details.- shrink
Either a numeric vector of length 2 (meant to work as both x and y components), or a list with components x and y which are numeric vectors of length 2. This allows the rectangles to be scaled proportional to the z-value. The specification can be made separately for widths (x) and heights (y). The elements of the length 2 numeric vector gives the minimum and maximum proportion of shrinkage (corresponding to min and max of z).
- labels
Either a logical scalar indicating whether the labels are to be drawn, or a character or expression vector giving the labels associated with the
atvalues. Alternatively,labelscan be a list with the following components:labels:a character or expression vector giving the labels. This can be omitted, in which case the defaults will be used.
col, cex, alpha:graphical parameters for label texts
fontfamily, fontface, font:font used for the labels
- label.style
Controls how label positions and rotation are determined. A value of
"flat"causes the label to be positioned where the contour is flattest, and the label is not rotated. A value of"align"causes the label to be drawn as far from the boundaries as possible, and the label is rotated to align with the contour at that point. The default is to mix these approaches, preferring the flattest location unless it is too close to the boundaries.- contour
A logical flag, specifying whether contour lines should be drawn.
- region
A logical flag, specifying whether inter-contour regions should be filled with appropriately colored rectangles.
- col, lty, lwd
Graphical parameters for contour lines.
- border
Border color for rectangles used when
region=TRUE.- border.lty, border.lwd
Graphical parameters for the border
- ...
Extra parameters.
- region.type
A character string, one of
"grid"and"contour". The former (the default) uses a grid of rectangles to display the colors for the level plot; the latter uses a grid of polygons, mimicking the behavior offilled.contour, which gives a smoother appearance at the cost of increased processing time.The
"contour"option requiresxandyto be complete, in the sense that it must include all possible combinations in the underlying grid. However,zvalues are allowed to be missing.- col.regions
A vector of colors, or a function to produce a vecor of colors, to be used if
region=TRUE. Each interval defined byatis assigned a color, so the number of colors actually used is one less than the length ofat. Seelevel.colorsfor details on how the color assignment is done.- alpha.regions
numeric scalar controlling transparency of facets
- interpolate
logical, passed to
grid.raster.- identifier
A character string that is prepended to the names of grobs that are created by this panel function.
Details
The same panel function is used for both levelplot and
contourplot (which differ only in default values of some
arguments). panel.contourplot is a simple wrapper to
panel.levelplot.
When contour=TRUE, the contourLines function is used to
calculate the contour lines.
panel.levelplot.raster is an alternative panel function that
uses the raster drawing abilities in R 2.11.0 and higher (through
grid.raster). It has fewer options (e.g., can only
render data on an equispaced grid), but can be more efficient. When
using panel.levelplot.raster, it may be desirable to render the
color key in the same way. This is possible, but must be done
separately; see levelplot for details.
Author
Deepayan Sarkar Deepayan.Sarkar@R-project.org.
The functionality of region.type = "contour" is based on code
borrowed from the gridGraphics package, written by Zhijian
(Jason) Wen and Paul Murrell and ported to lattice by Johan Larsson.
Examples
require(grid)
#> Loading required package: grid
levelplot(rnorm(10) ~ 1:10 + sort(runif(10)), panel = panel.levelplot)
 suppressWarnings(plot(levelplot(rnorm(10) ~ 1:10 + sort(runif(10)),
panel = panel.levelplot.raster,
interpolate = TRUE)))
suppressWarnings(plot(levelplot(rnorm(10) ~ 1:10 + sort(runif(10)),
panel = panel.levelplot.raster,
interpolate = TRUE)))
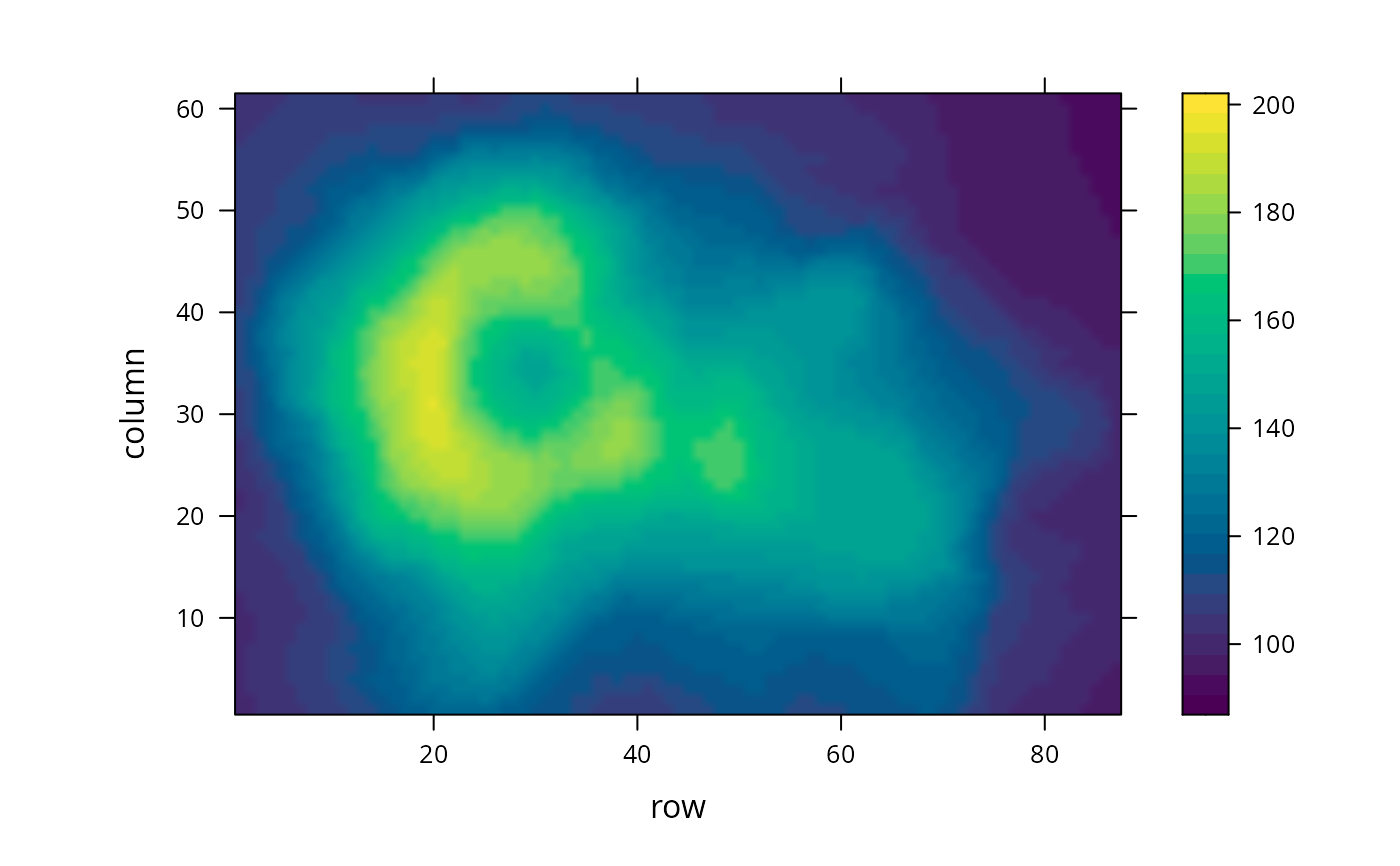
 levelplot(volcano, panel = panel.levelplot.raster)
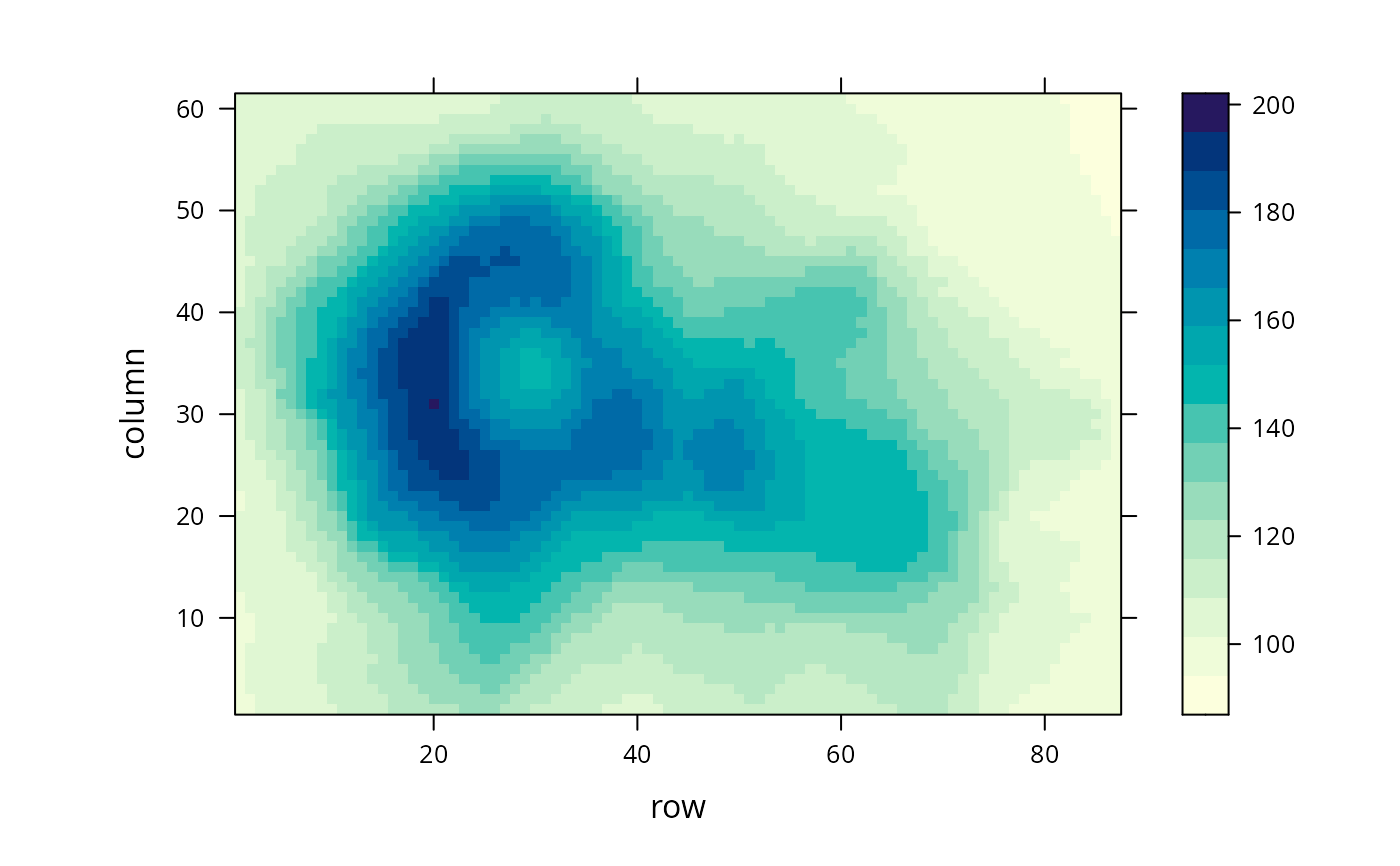 levelplot(volcano, panel = panel.levelplot.raster,
col.regions = hcl.colors, cuts = 30, interpolate = TRUE)
levelplot(volcano, panel = panel.levelplot.raster,
col.regions = hcl.colors, cuts = 30, interpolate = TRUE)