Reference lines: horizontal plus vertical, and quadrants
Source:R/geom-quadrant-lines.R
geom_quadrant_lines.Rdgeom_vhlines() adds in a single layer both vertical and horizontal
guide lines. Can be thought of as a convenience function that helps with
producing consistent vertical and horizontal guide lines. It behaves like
geom_vline() and geom_hline().
geom_quadrant_lines() displays the boundaries of four quadrants
with an arbitrary origin. The quadrants are specified in the same way as
in stat_quadrant_counts() and is intended to be used to add guide
lines consistent with the counts by quadrant computed by this stat.
geom_quadrant_lines(
  mapping = NULL,
  data = NULL,
  stat = "identity",
  position = "identity",
  pool.along = c("none", "x", "y", "xy"),
  xintercept = 0,
  yintercept = 0,
  na.rm = FALSE,
  show.legend = FALSE,
  inherit.aes = FALSE,
  ...
)

geom_vhlines(
  mapping = NULL,
  data = NULL,
  stat = "identity",
  position = "identity",
  xintercept = NULL,
  yintercept = NULL,
  na.rm = FALSE,
  show.legend = FALSE,
  inherit.aes = FALSE,
  ...
)
Arguments
- mapping
The aesthetic mapping, usually constructed with
aes. Only needs to be set at the layer level if you are overriding the plot defaults.- data
A layer specific data set - only needed if you want to override the plot defaults.
- stat
The statistic object to use display the data
- position
The position adjustment to use for overlapping points on this layer
- pool.along
character, one of
"none","x","y", or"xy"indicating whether to plot or not lines separating quadrants.- xintercept, yintercept
numeric vectors the coordinates of the origin of the quadrants.
- na.rm
a logical indicating whether NA values should be stripped before the computation proceeds.
- show.legend
logical. Should this layer be included in the legends?
NA, the default, includes if any aesthetics are mapped.FALSEnever includes, andTRUEalways includes.- inherit.aes
If
FALSE, overrides the default aesthetics, rather than combining with them. This is most useful for helper functions that define both data and aesthetics and should not inherit behaviour from the default plot specification, e.g.borders.- ...
other arguments passed on to
layer. This can include aesthetics whose values you want to set, not map. Seelayerfor more details.
Value
A plot layer instance.
Details
While geom_vhlines() does not provide defaults for the
intercepts and accepts vectors of length > 1, geom_quadrant_lines()
sets by default the intercepts to zero producing the natural quadrants and
only accepts vectors of length one per panel. That is geom_vhlines()
can be used to plot a grid while geom_quadrant_lines() plots at
most one vertical and one horizontal line. In the case of
geom_quadrant_lines() the pooling along axes can be specified in the
same way as in stat_quadrant_counts().
See also
geom_abline, the topic where
geom_vline() and geom_hline() are described.
Other Functions for quadrant and volcano plots:
stat_panel_counts(),
stat_quadrant_counts()
Examples
# generate artificial data
set.seed(4321)
x <- 1:100
y <- rnorm(length(x), mean = 10)
my.data <- data.frame(x, y)
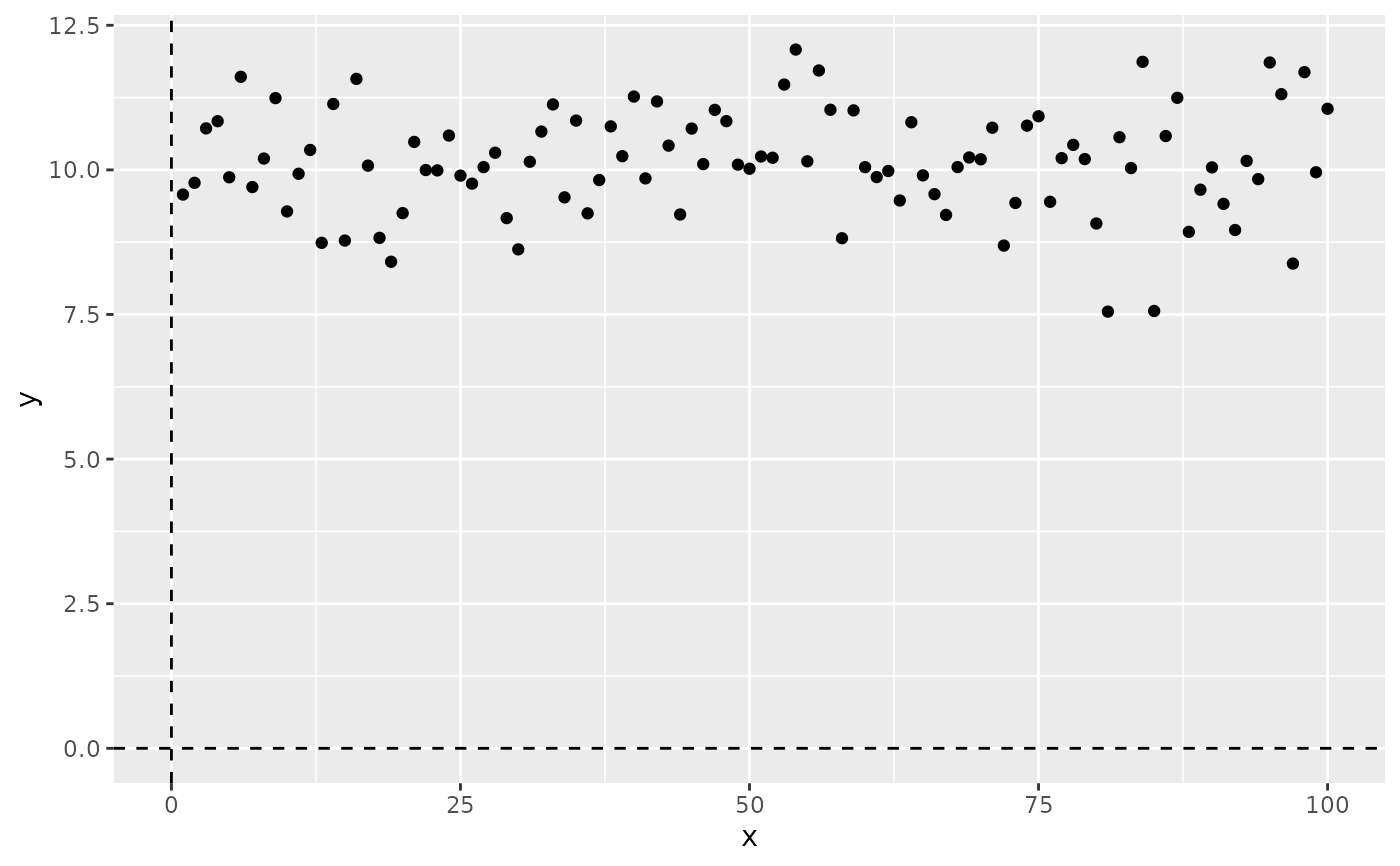
ggplot(my.data, aes(x, y)) +
geom_quadrant_lines() +
geom_point()
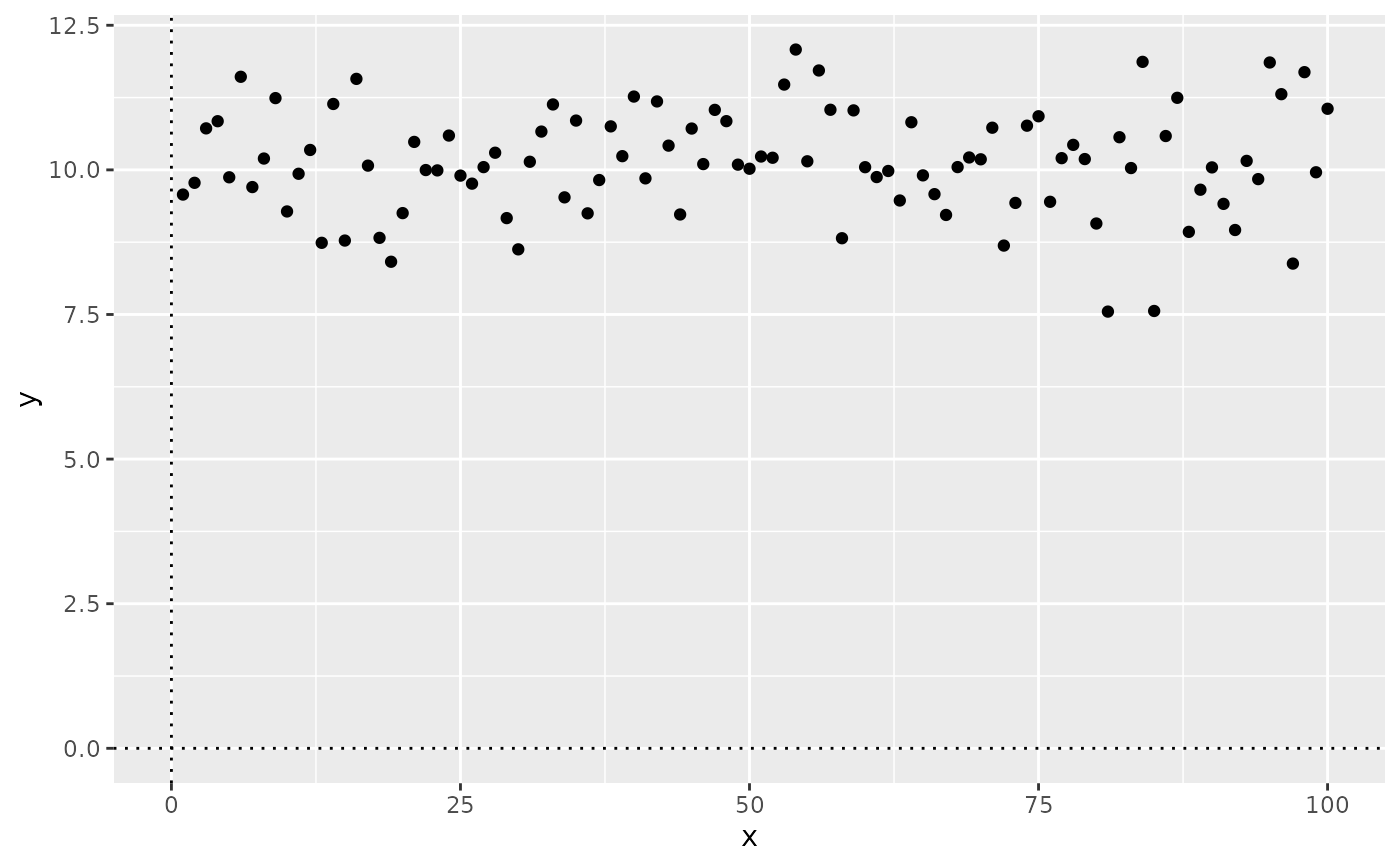
 ggplot(my.data, aes(x, y)) +
geom_quadrant_lines(linetype = "dotted") +
geom_point()
ggplot(my.data, aes(x, y)) +
geom_quadrant_lines(linetype = "dotted") +
geom_point()
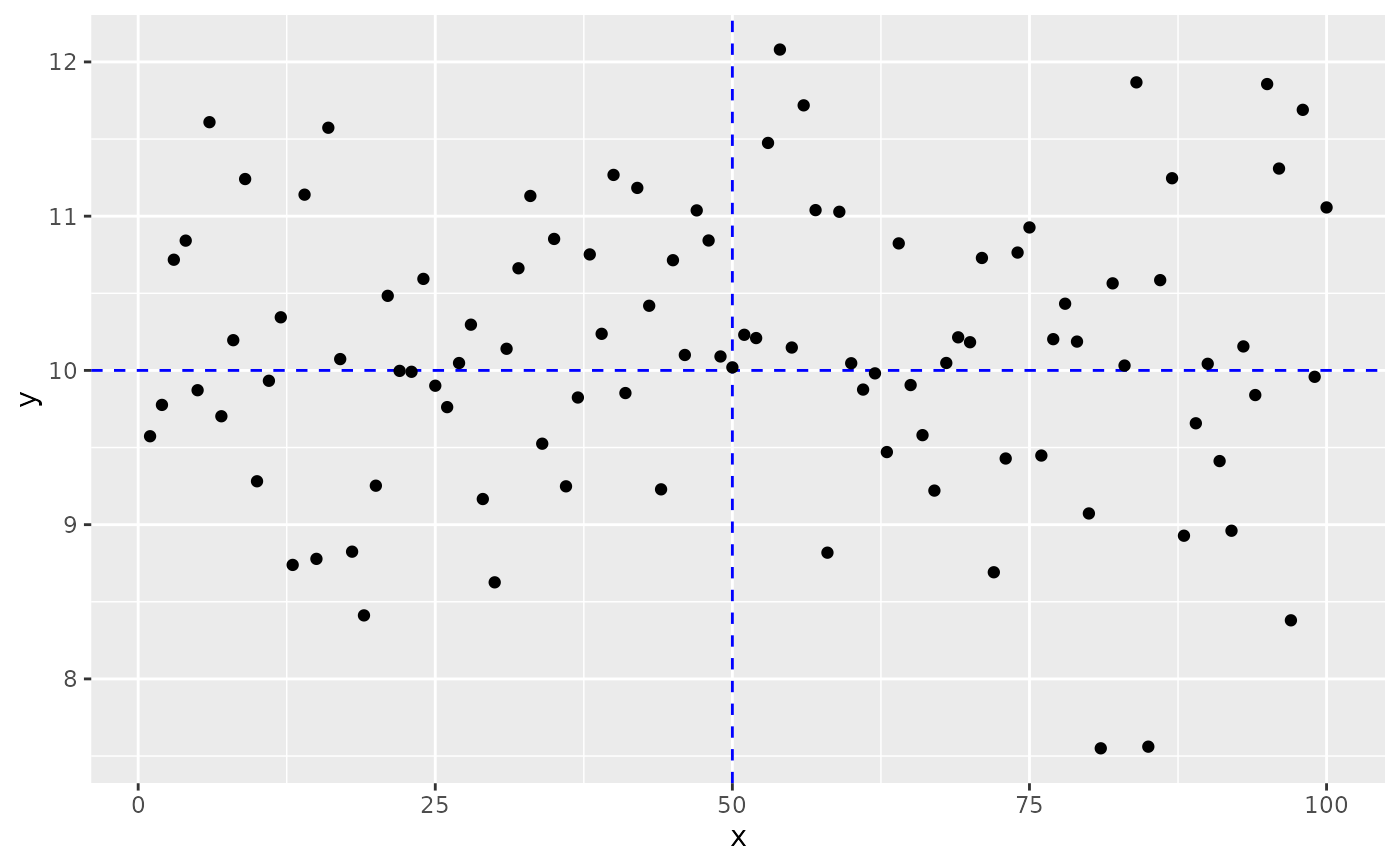
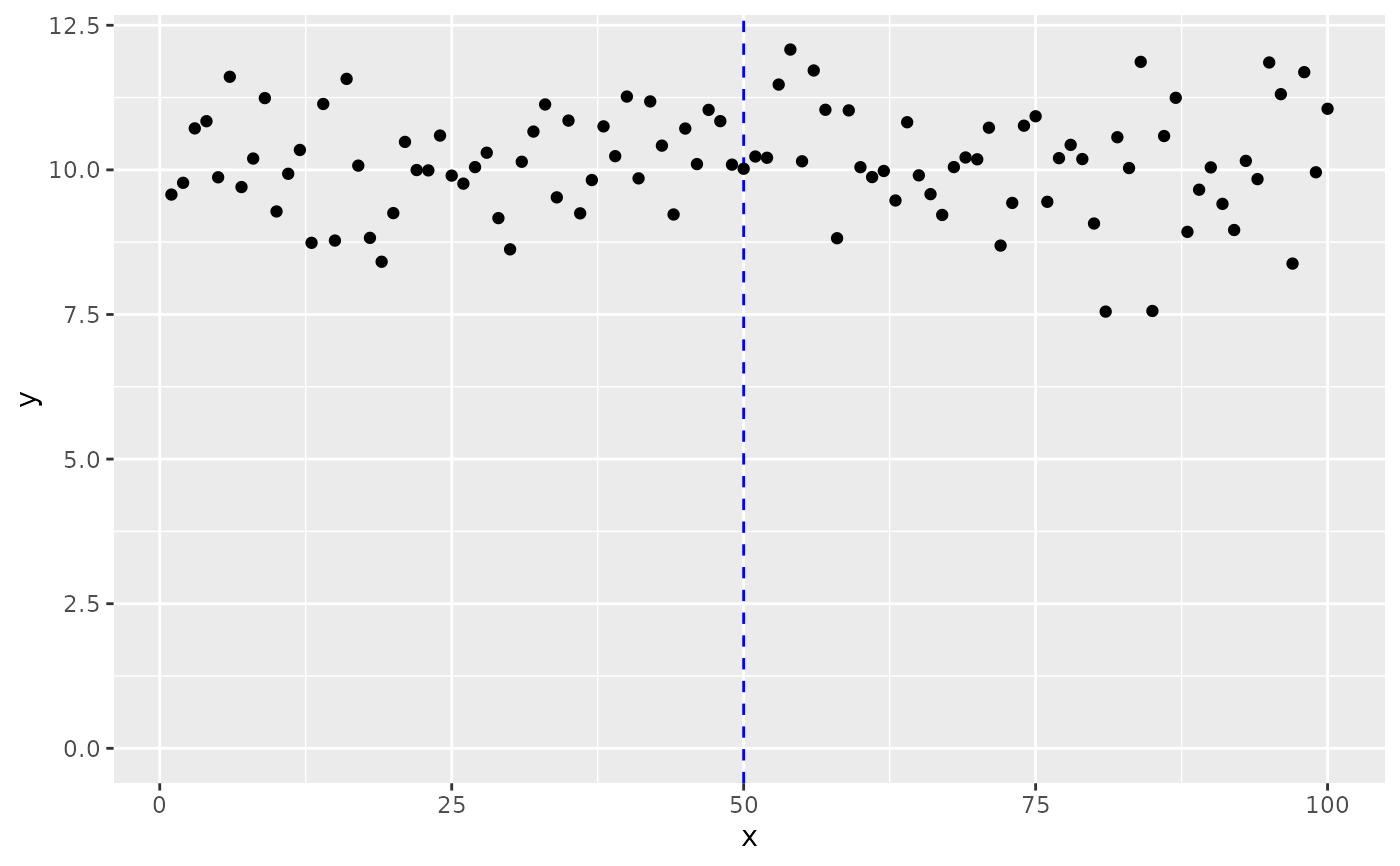
 ggplot(my.data, aes(x, y)) +
geom_quadrant_lines(xintercept = 50,
yintercept = 10,
colour = "blue") +
geom_point()
ggplot(my.data, aes(x, y)) +
geom_quadrant_lines(xintercept = 50,
yintercept = 10,
colour = "blue") +
geom_point()
 ggplot(my.data, aes(x, y)) +
geom_quadrant_lines(xintercept = 50,
pool.along = "y",
colour = "blue") +
geom_point()
ggplot(my.data, aes(x, y)) +
geom_quadrant_lines(xintercept = 50,
pool.along = "y",
colour = "blue") +
geom_point()
 ggplot(my.data, aes(x, y)) +
geom_vhlines(xintercept = c(25, 50, 75),
yintercept = 10 ,
linetype = "dotted",
colour = "red") +
geom_point() +
theme_bw()
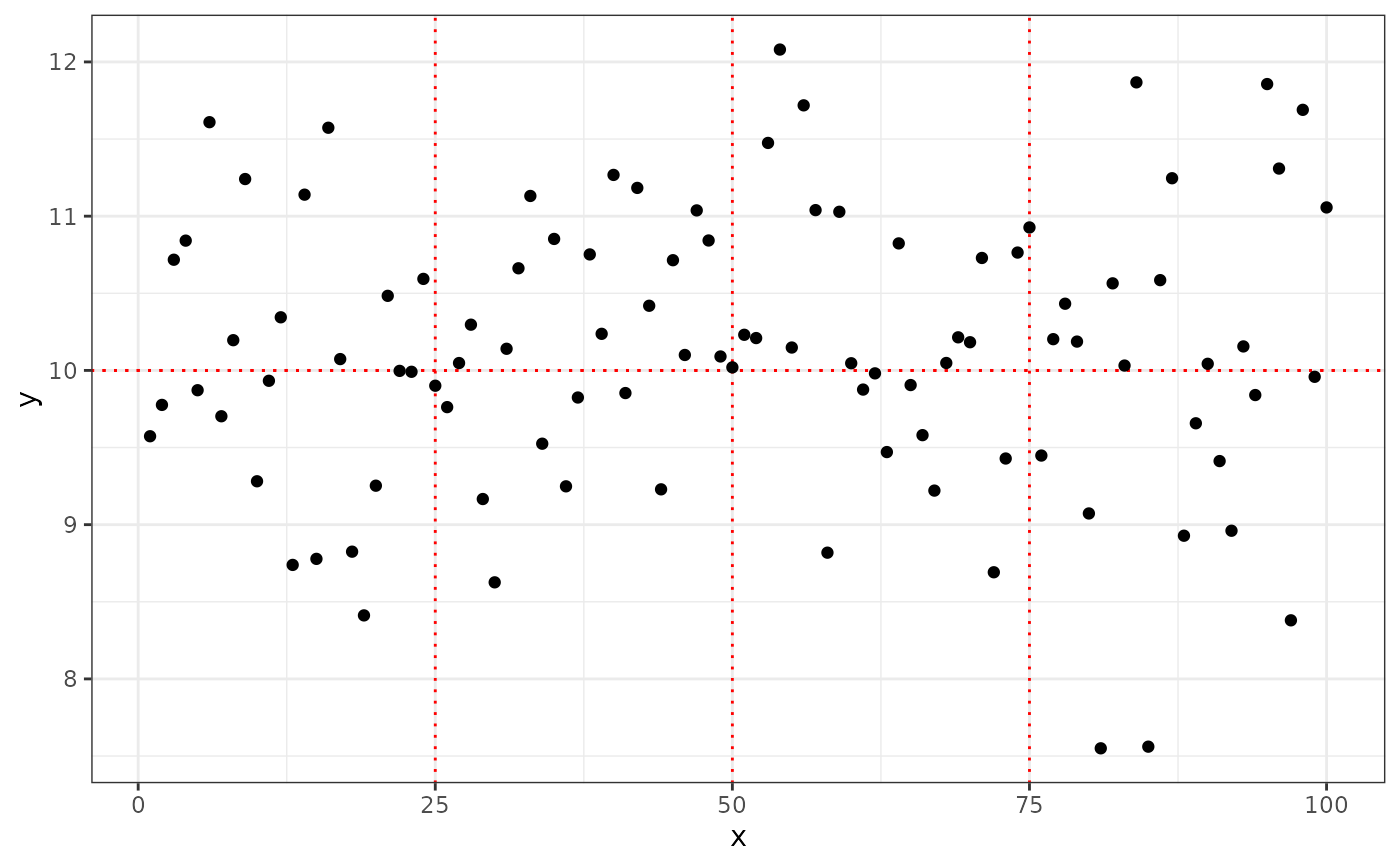
ggplot(my.data, aes(x, y)) +
geom_vhlines(xintercept = c(25, 50, 75),
yintercept = 10 ,
linetype = "dotted",
colour = "red") +
geom_point() +
theme_bw()
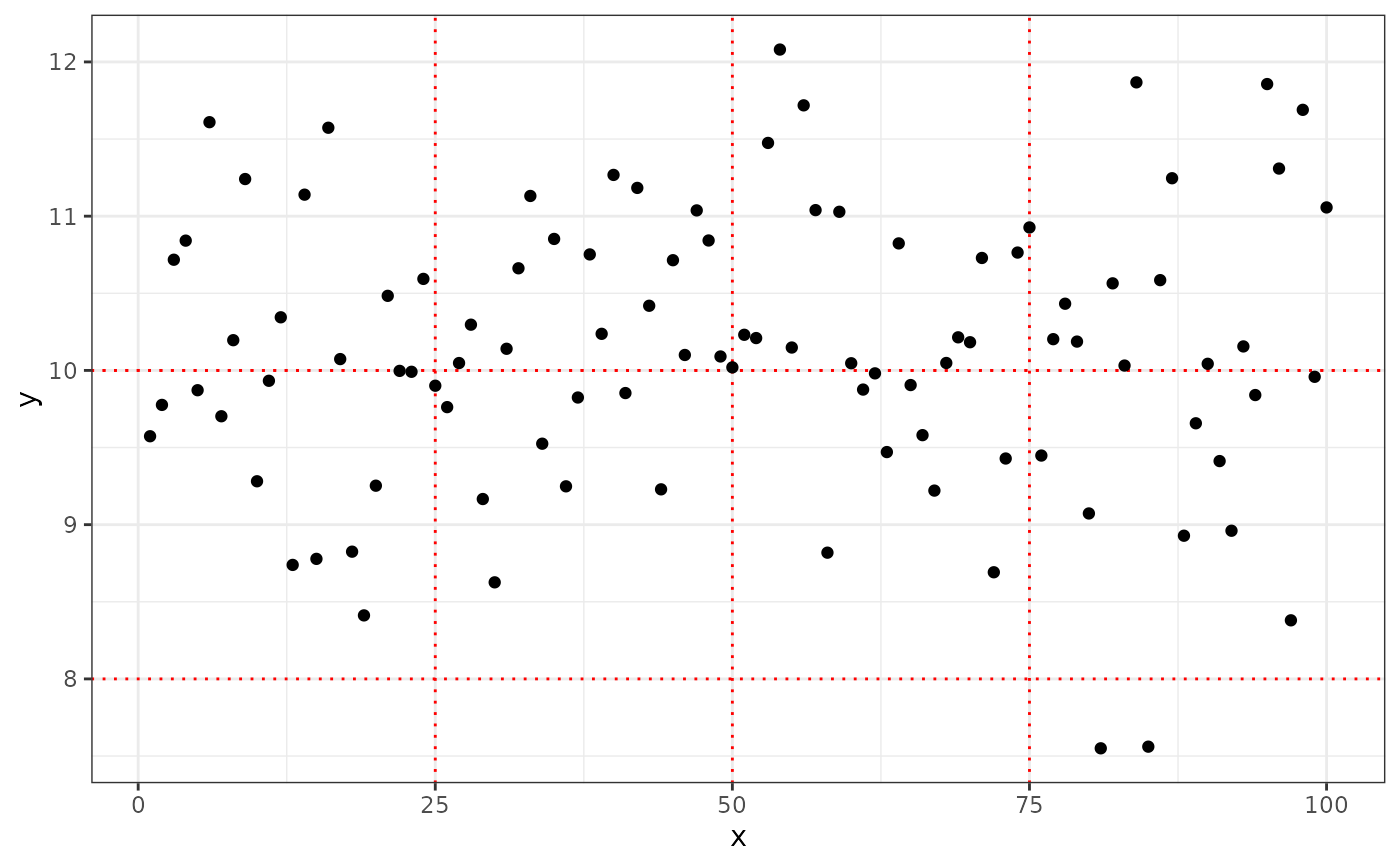
 ggplot(my.data, aes(x, y)) +
geom_vhlines(xintercept = c(25, 50, 75),
yintercept = c(10, 8),
linetype = "dotted",
colour = "red") +
geom_point() +
theme_bw()
ggplot(my.data, aes(x, y)) +
geom_vhlines(xintercept = c(25, 50, 75),
yintercept = c(10, 8),
linetype = "dotted",
colour = "red") +
geom_point() +
theme_bw()