Ellipses, Data Ellipses, and Confidence Ellipses
Ellipses.RdThese functions draw ellipses, including data ellipses, and confidence ellipses for linear, generalized linear, and possibly other models.
Usage
ellipse(center, shape, radius, log="", center.pch=19, center.cex=1.5,
  segments=51, draw=TRUE, add=draw, xlab="", ylab="",
  col=carPalette()[2], lwd=2, fill=FALSE, fill.alpha=0.3, grid=TRUE, ...)

dataEllipse(x, ...)

# S3 method for class 'formula'
dataEllipse(formula, data, subset, weights, xlab, ylab, id=FALSE, ...)

# Default S3 method
dataEllipse(x, y, groups,
  group.labels=group.levels, ellipse.label,
  weights, log="", levels=c(0.5, 0.95), center.pch=19,
  center.cex=1.5, draw=TRUE, plot.points=draw, add=!plot.points, segments=51,
  robust=FALSE,
  xlab=deparse(substitute(x)),
  ylab=deparse(substitute(y)),
  col=if (missing(groups)) carPalette()[1:2] else carPalette()[1:length(group.levels)],
  pch=if (missing(groups)) 1 else seq(group.levels),
  lwd=2, fill=FALSE, fill.alpha=0.3, grid=TRUE, id=FALSE,
  label.pos=NULL, label.cex=1.25, label.xpd=FALSE, ...)

confidenceEllipse(model, ...)

# S3 method for class 'lm'
confidenceEllipse(model, which.coef, vcov.=vcov,
  L, levels=0.95, Scheffe=FALSE, dfn,
  center.pch=19, center.cex=1.5, segments=51, xlab, ylab,
  col=carPalette()[2], lwd=2, fill=FALSE, fill.alpha=0.3, draw=TRUE, add=!draw,
  grid=TRUE, ...)

# S3 method for class 'glm'
confidenceEllipse(model, chisq, ...)

# S3 method for class 'mlm'
confidenceEllipse(model, xlab, ylab, which.coef=1:2, ...)

# Default S3 method
confidenceEllipse(model, which.coef, vcov.=vcov,
  L, levels=0.95, Scheffe=FALSE,  dfn,
  center.pch=19, center.cex=1.5, segments=51, xlab, ylab,
  col=carPalette()[2], lwd=2, fill=FALSE, fill.alpha=0.3, draw=TRUE, add=!draw,
  grid=TRUE, ...)

confidenceEllipses(model, ...)

# Default S3 method
confidenceEllipses(model, coefnames,  main, grid=TRUE, ...)

# S3 method for class 'mlm'
confidenceEllipses(model, coefnames, main, ...)
Arguments
- center
2-element vector with coordinates of center of ellipse.
- shape
\(2\times 2\) shape (or covariance) matrix.
- radius
radius of circle generating the ellipse.
- log
when an ellipse is to be added to an existing plot, indicates whether computations were on logged values and to be plotted on logged axes;
"x"if the x-axis is logged,"y"if the y-axis is logged, and"xy"or"yx"if both axes are logged. The default is"", indicating that neither axis is logged.- center.pch
character for plotting ellipse center; if
FALSEorNULLthe center point isn't plotted.- center.cex
relative size of character for plotting ellipse center.
- segments
number of line-segments used to draw ellipse.
- draw
if
TRUEproduce graphical output; ifFALSE, only invisibly return coordinates of ellipse(s).- add
if
TRUEadd ellipse(s) to current plot.- xlab
label for horizontal axis.
- ylab
label for vertical axis.
- x
a numeric vector, or (if
yis missing) a 2-column numeric matrix.- y
a numeric vector, of the same length as
x.- groups
optional: a factor to divide the data into groups; a separate ellipse will be plotted for each group (level of the factor).
- formula
for the formula method, a model formula, of the form
y ~ xor, if plotting by groups,y ~ x | z, wherezevaluates to a factor or other variable dividing the data into groups.- data
for the formula method, a data frame within which to evaluate the formula.
- subset
for the formula method, expression defining a subset of observations.
- group.labels
labels to be plotted for the groups; by default, the levels of the
groupsfactor.- ellipse.label
a label for the ellipse(s) or a vector of labels; if several ellipses are drawn and just one label is given, then that label will be repeated. The default is not to label the ellipses.
- label.pos
position(s) of labels for the ellipses, a vector of integers (in 0:4) or character strings (in c("center", "bottom", "left", "top", "right"), or in c("C", "S", "W", "N", "E") used in labeling ellipses, recycled as necessary. Values of 1, 2, 3 and 4, respectively indicate positions below, to the left of, above and to the right of the max/min coordinates of the ellipse; the value 0 specifies the centroid of the ellipse object. The default,
label.pos=NULLuses the correlation of the ellipse to determine "top" (r>=0) or "bottom" (r<0)
.
- label.cex
character size for ellipse labels.
- label.xpd
allow labels to be drawn outside of plotting region (default
FALSE).- weights
a numeric vector of weights, of the same length as
xandyto be used bycov.wtorcov.trobin computing a weighted covariance matrix; if absent, weights of1are used.- plot.points
if
FALSEdata ellipses are drawn, but points are not plotted.- levels
draw elliptical contours at these (normal) probability or confidence levels.
- robust
if
TRUEuse thecov.trobfunction in the MASS package to calculate the center and covariance matrix for the data ellipse.- model
a model object produced by
lmorglm.- which.coef
2-element vector giving indices of coefficients to plot; if missing, the first two coefficients (disregarding the regression constant) will be selected.
- vcov.
a coefficient-covariance matrix or a function (such as
hccm) to compute the coefficent-covariance matrix frommodel; the default is thevcovfunction.Note that arguments supplied to
...are not passed tovcov.when it's a function; in this case either use an anonymous function in which the additional arguments are set, or supply the coefficient covariance matrix directly.- L
As an alternative to selecting coefficients to plot, a transformation matrix can be specified to compute two linear combinations of the coefficients; if the
Lmatrix is given, it takes precedence over thewhich.coefargument.Lshould have two rows and as many columns as there are coefficients. It can be given directly as a numeric matrix, or specified by a pair of character-valued expressions, in the same manner as for thelink{linearHypothesis}function, but with no right-hand side.- Scheffe
if
TRUEscale the ellipse so that its projections onto the axes give Scheffe confidence intervals for the coefficients.- dfn
“numerator” degrees of freedom (or just degrees of freedom for a GLM) for drawing the confidence ellipse. Defaults to the number of coefficients in the model (disregarding the constant) if
ScheffeisTRUE, or to2otherwise; selectingdfn = 1will draw the “confidence-interval generating” ellipse, with projections on the axes corresponding to individual confidence intervals with the stated level of coverage.- chisq
if
TRUE, the confidence ellipse for the coefficients in a generalized linear model are based on the chisquare statistic, ifFALSEon the $F$-statistic. This corresponds to using the default and linear-model methods respectively.- col
color for lines and ellipse center; the default is the second entry in the current car palette (see
carPaletteandpar). FordataEllipse, two colors can be given, in which case the first is for plotted points and the second for lines and the ellipse center; if ellipses are plotted forgroups, then this is a vector of colors for the groups.- pch
for
dataEllipsethis is the plotting character (default, symbol1, a hollow circle) to use for the points; if ellipses are plotted bygroups, then this a vector of plotting characters, with consecutive symbols starting with1as the default.- lwd
line width; default is
2(seepar).- fill
fill the ellipse with translucent color
col(default,FALSE)?- fill.alpha
transparency of fill (default =
0.3).- ...
other plotting parameters to be passed to
plotandline.- id
controls point identification; if
FALSE(the default), no points are identified; can be a list of named arguments to theshowLabelsfunction;TRUEis equivalent tolist(method="mahal", n=2, cex=1, col=carPalette()[1], location="lr")(with the defaultcolactually dependent on the number of groups), which identifies the 2 points with the largest Mahalanobis distances from the center of the data.- grid
If TRUE, the default, a light-gray background grid is put on the graph
- coefnames
character vector of coefficient names to use to label the diagonal of the pairwise confidence ellipse matrix plotted by
confidenceEllipses; defaults to the names of the coefficients in the model.- main
title for matrix of pairwise confidence ellipses.
Details
The ellipse is computed by suitably transforming a unit circle.
dataEllipse superimposes the normal-probability contours over a scatterplot
of the data.
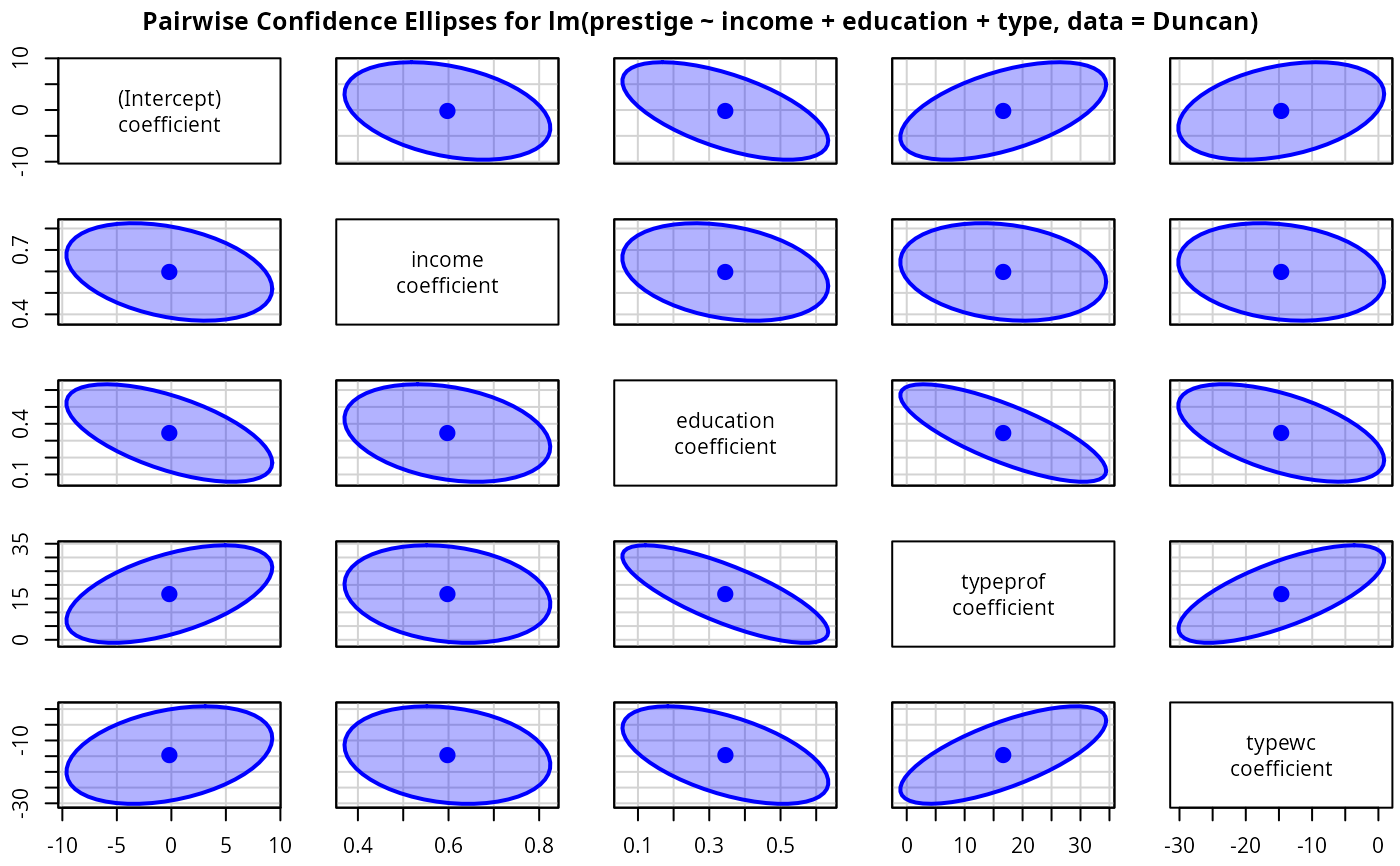
confidenceEllipses plots a matrix of all pairwise confidence ellipses; each panel of the matrix is created by confidenceEllipse.
Value
These functions are mainly used for their side effect of producing plots. For
greater flexibility (e.g., adding plot annotations), however, ellipse returns invisibly the (x, y) coordinates of the calculated ellipse.
dataEllipse and confidenceEllipse return invisibly the coordinates of one or more ellipses, in the latter instance a list named by
levels; confidenceEllipses invisibly returns NULL.
References
Fox, J. (2016) Applied Regression Analysis and Generalized Linear Models, Third Edition. Sage.
Fox, J. and Weisberg, S. (2019) An R Companion to Applied Regression, Third Edition, Sage.
Monette, G. (1990) Geometry of multiple regression and 3D graphics. In Fox, J. and Long, J. S. (Eds.) Modern Methods of Data Analysis. Sage.
Author
Georges Monette, John Fox jfox@mcmaster.ca, and Michael Friendly.
Examples
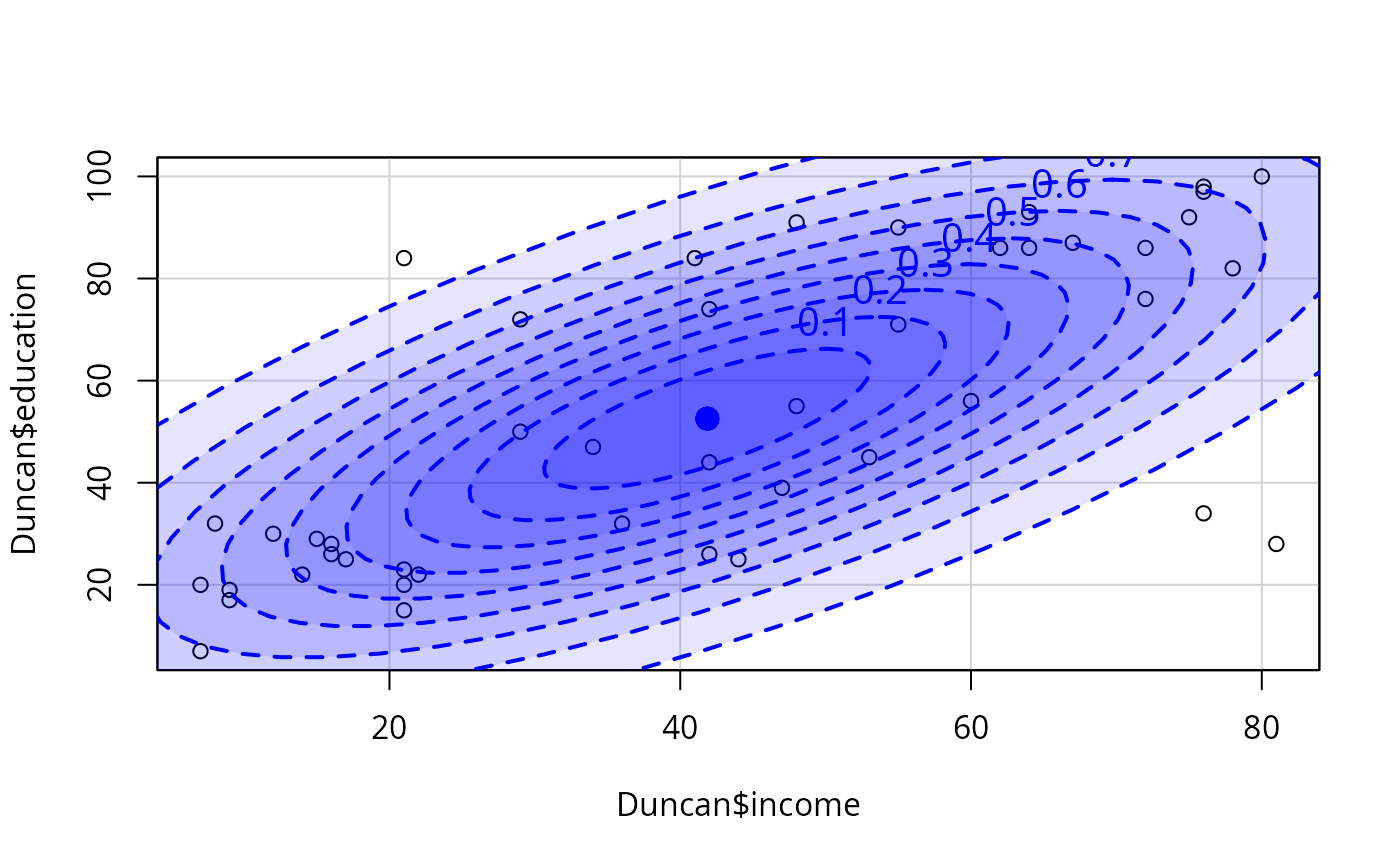
dataEllipse(Duncan$income, Duncan$education, levels=0.1*1:9,
ellipse.label=0.1*1:9, lty=2, fill=TRUE, fill.alpha=0.1)
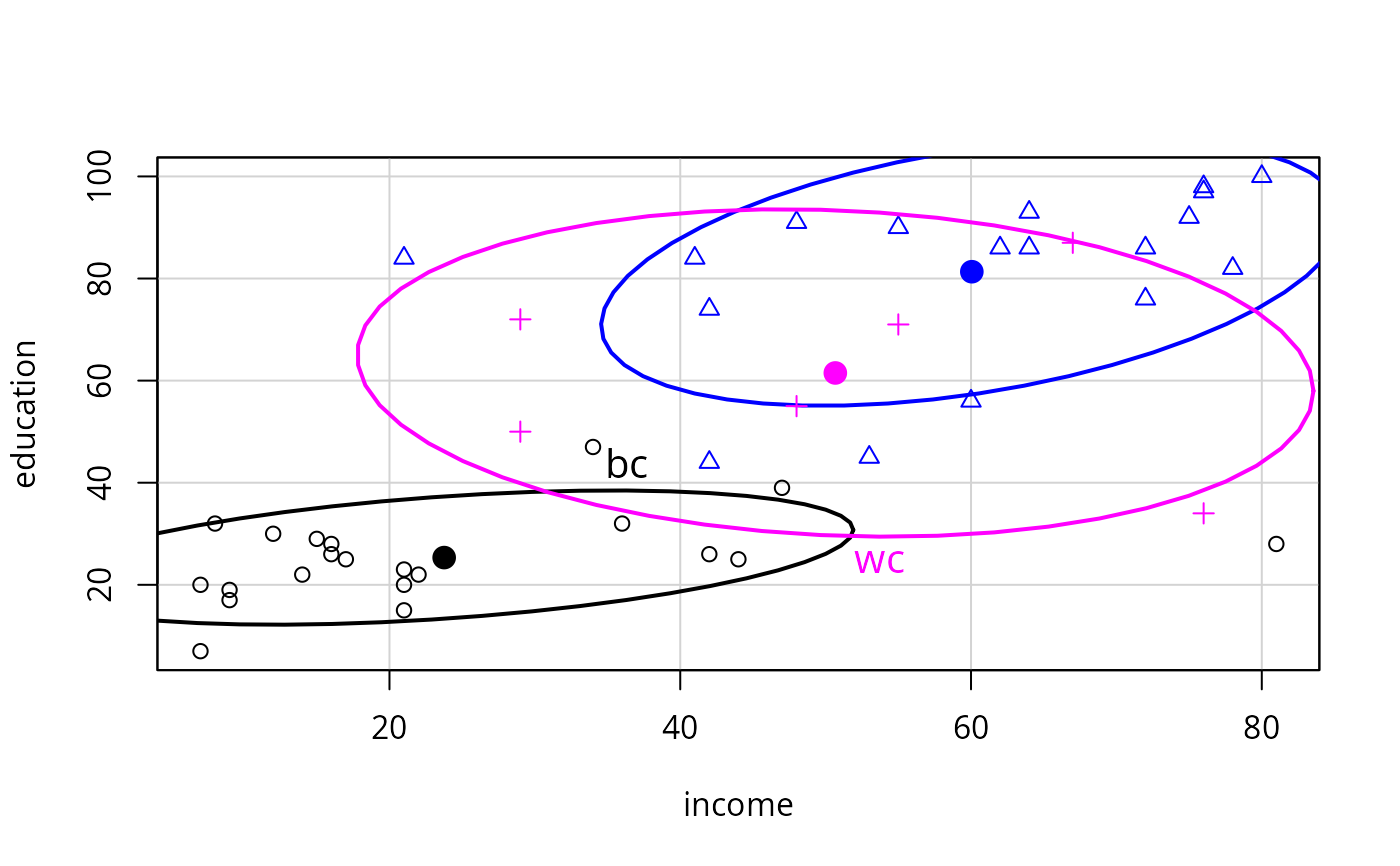
 # formula method
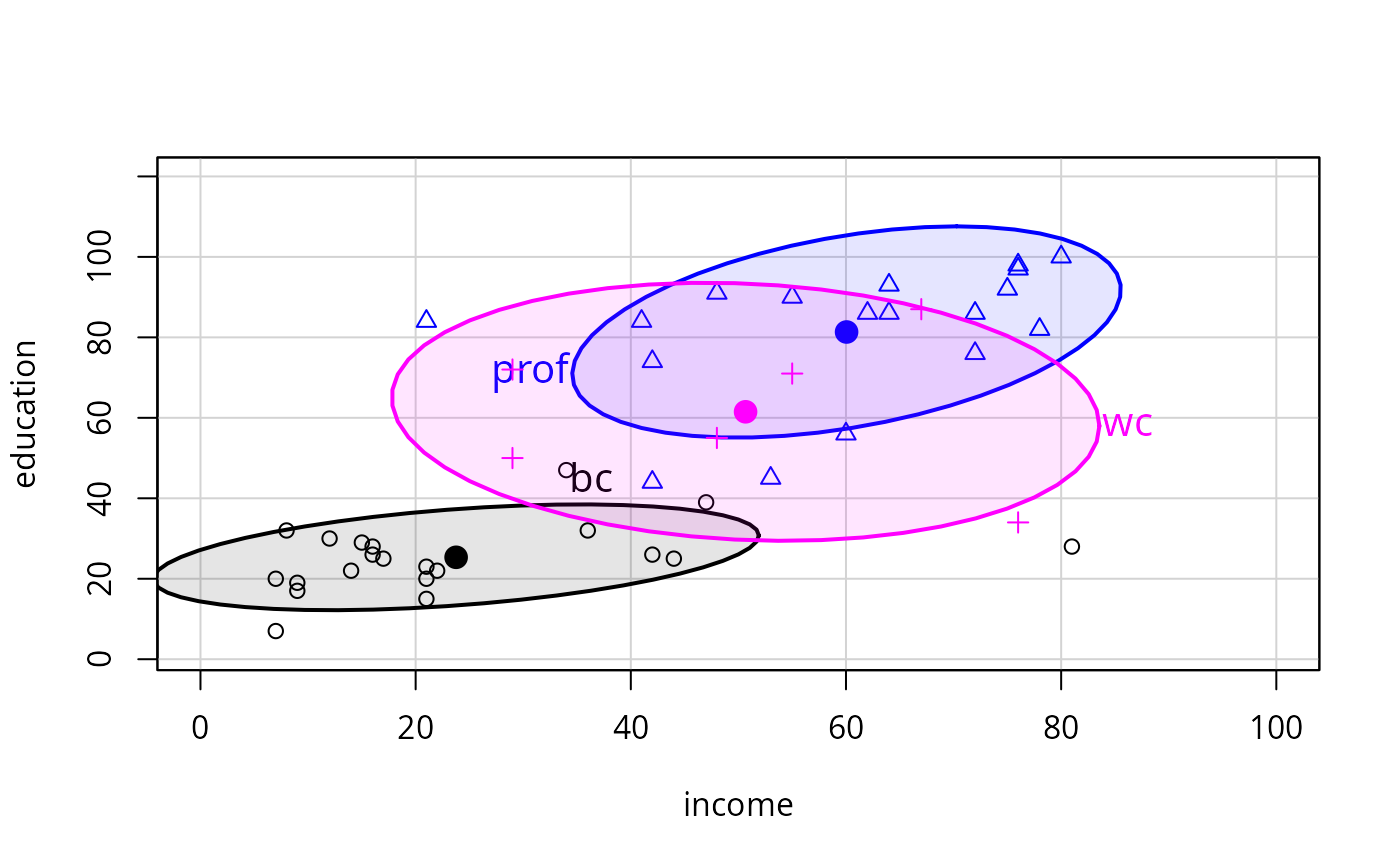
dataEllipse(education ~ income | type, data=Duncan,
levels = 0.68)
# formula method
dataEllipse(education ~ income | type, data=Duncan,
levels = 0.68)
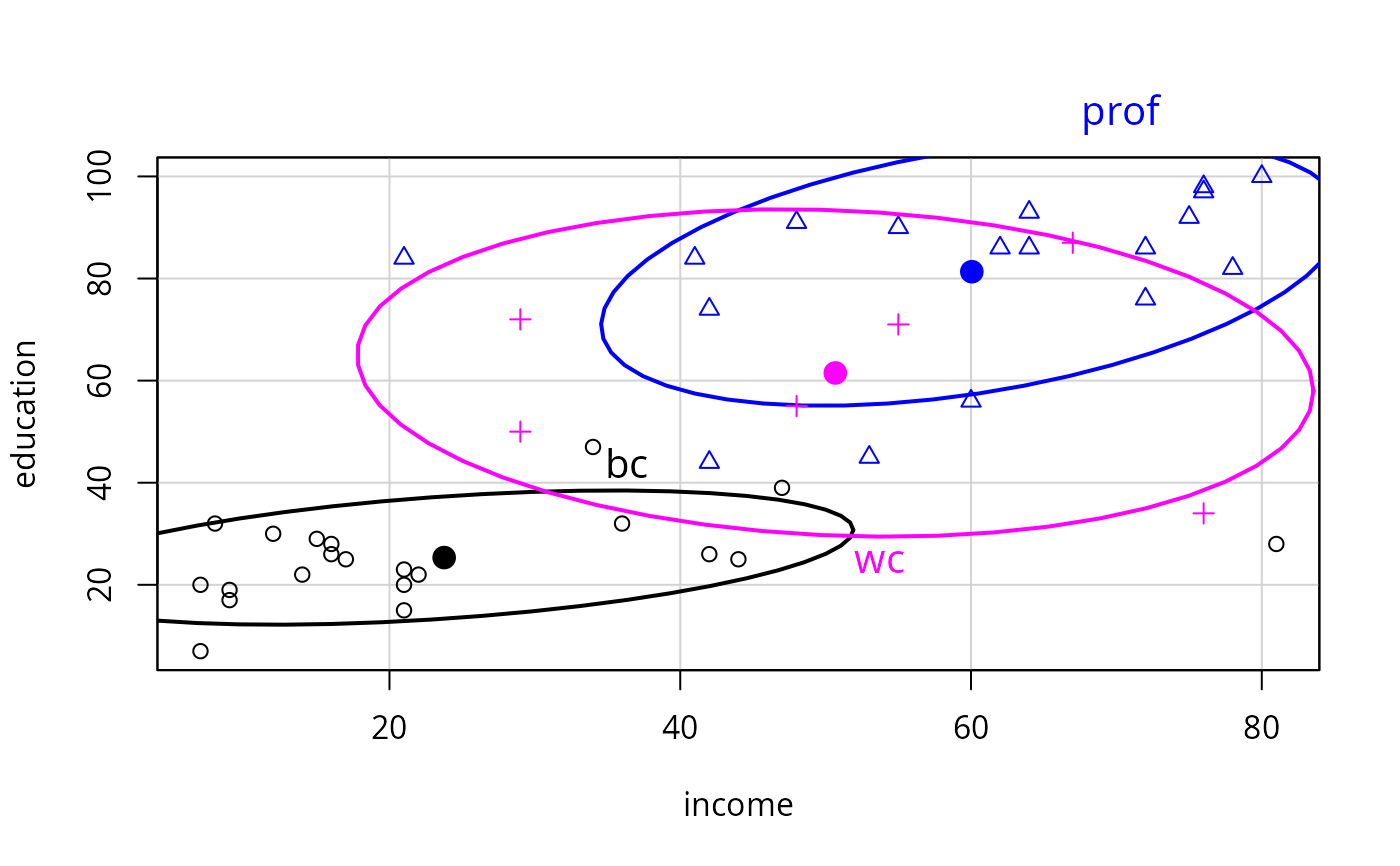
 dataEllipse(education ~ income | type, data=Duncan,
levels=0.68, label.xpd=TRUE)
dataEllipse(education ~ income | type, data=Duncan,
levels=0.68, label.xpd=TRUE)
 # vary label positions
dataEllipse(education ~ income | type, data=Duncan,
levels = 0.68,
fill = TRUE, fill.alpha = 0.1,
label.pos = c(3, 2, 4),
xlim = c(0, 100),
ylim = c(2, 120))
# vary label positions
dataEllipse(education ~ income | type, data=Duncan,
levels = 0.68,
fill = TRUE, fill.alpha = 0.1,
label.pos = c(3, 2, 4),
xlim = c(0, 100),
ylim = c(2, 120))
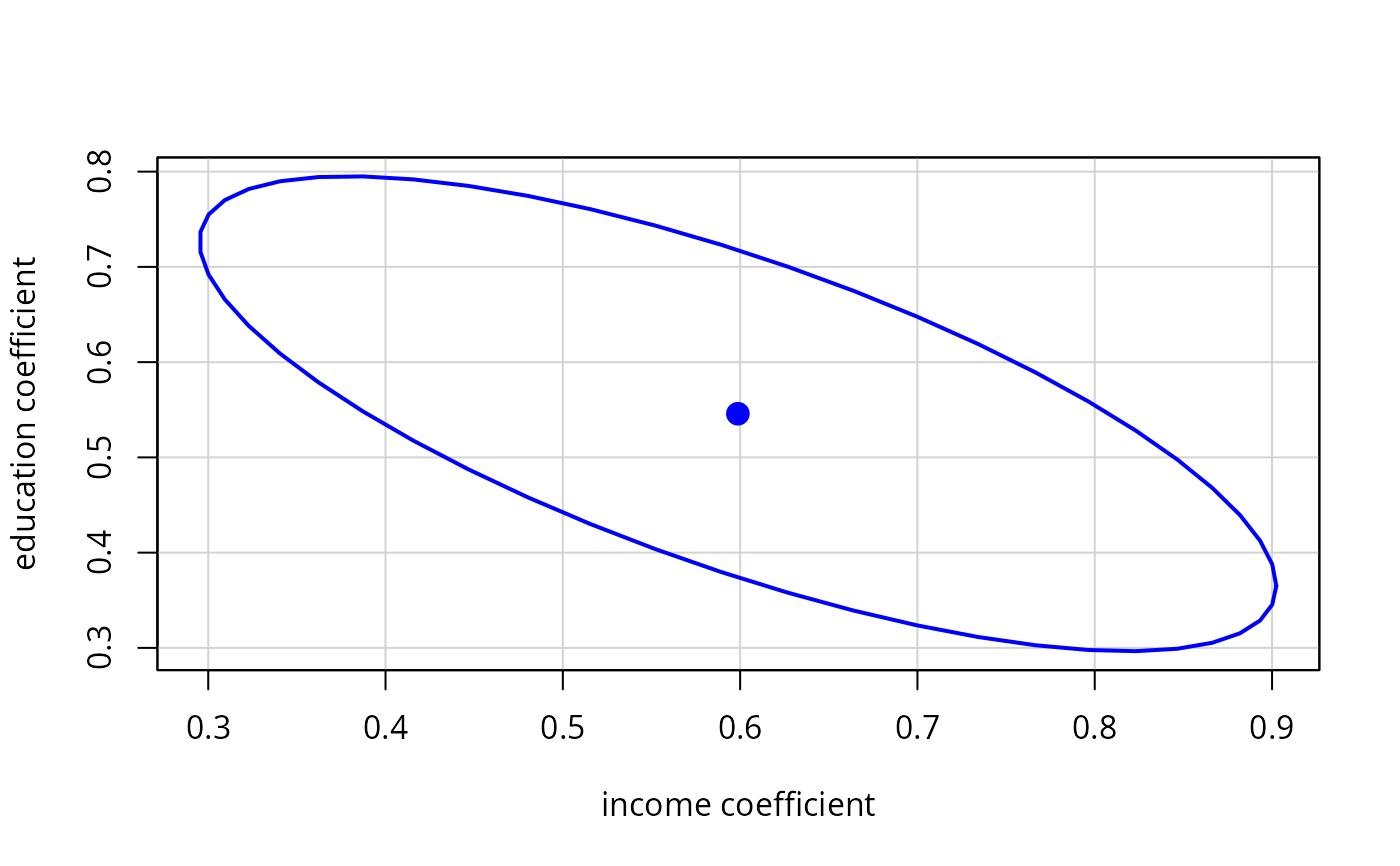
 confidenceEllipse(lm(prestige ~ income + education, data=Duncan), Scheffe=TRUE)
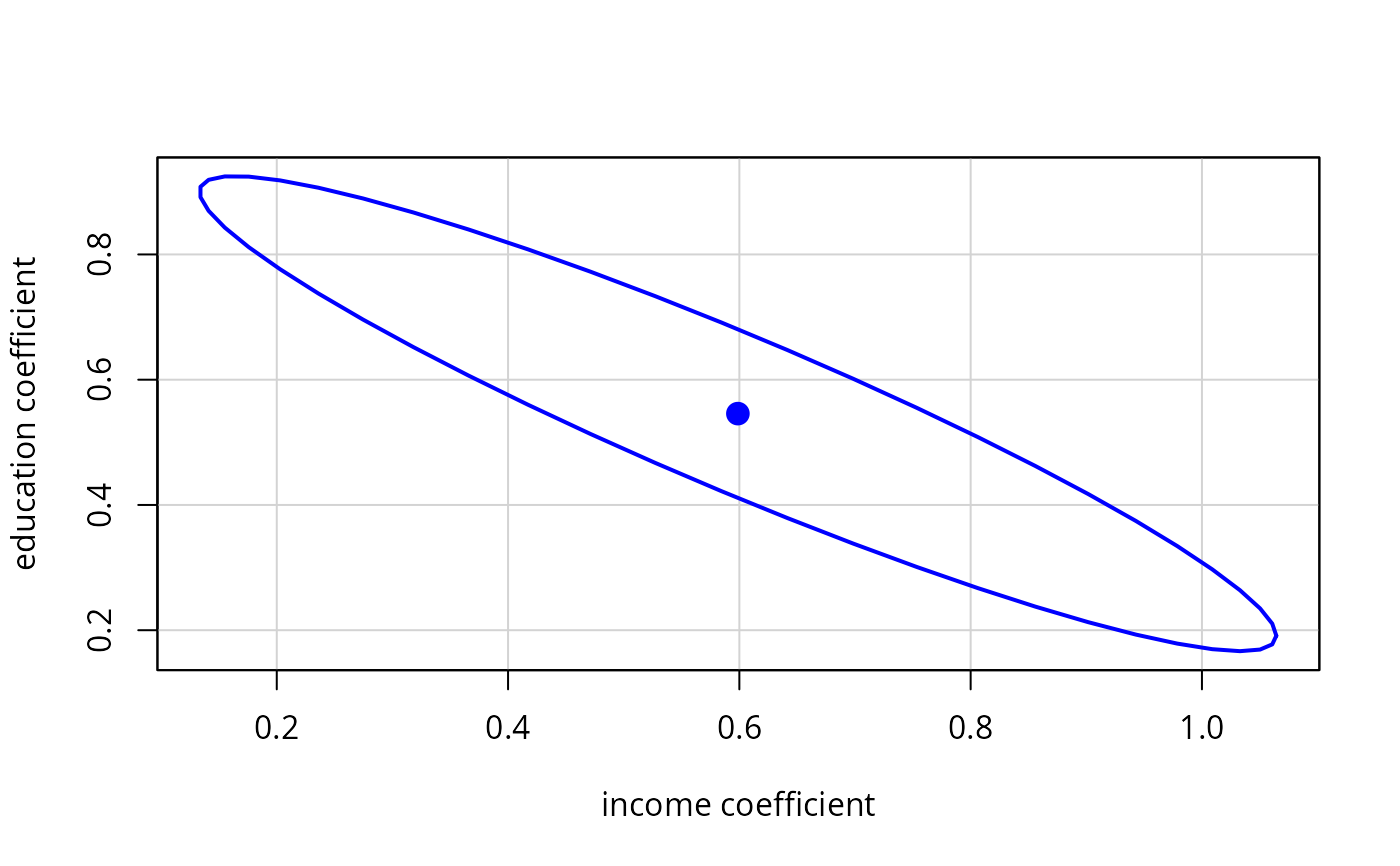
 confidenceEllipse(lm(prestige ~ income + education, data=Duncan), vcov.=hccm)
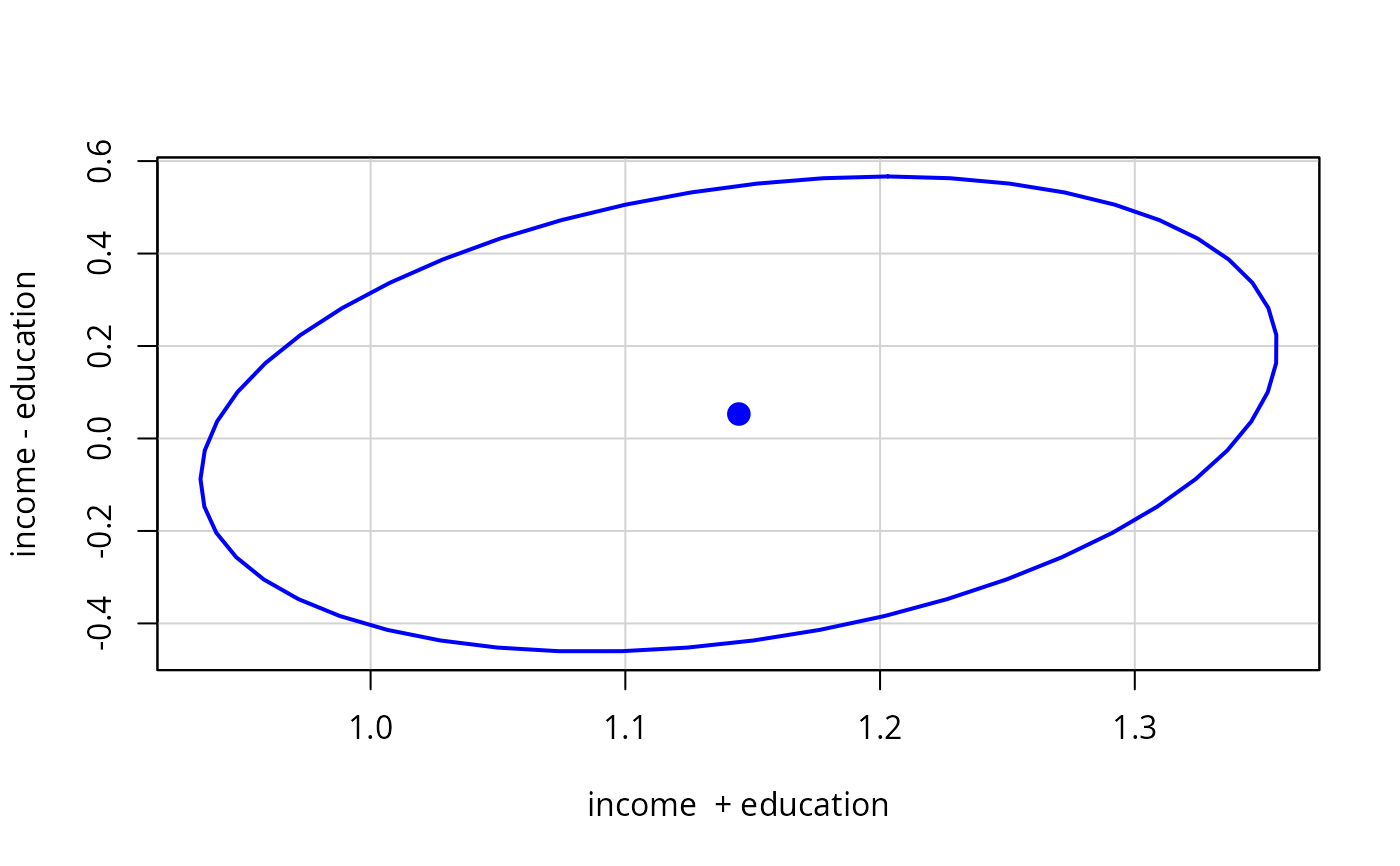
 confidenceEllipse(lm(prestige ~ income + education, data=Duncan),
L=c("income + education", "income - education"))
confidenceEllipse(lm(prestige ~ income + education, data=Duncan),
L=c("income + education", "income - education"))
 confidenceEllipses(lm(prestige ~ income + education + type, data=Duncan),
fill=TRUE)
confidenceEllipses(lm(prestige ~ income + education + type, data=Duncan),
fill=TRUE)
 cov2cor(vcov(lm(prestige ~ income + education + type,
data=Duncan))) # correlations among coefficients
#> (Intercept) income education typeprof typewc
#> (Intercept) 1.0000000 -0.3484661 -0.6102747 0.5427211 0.3483203
#> income -0.3484661 1.0000000 -0.2880828 -0.2016613 -0.1997770
#> education -0.6102747 -0.2880828 1.0000000 -0.7761809 -0.5592417
#> typeprof 0.5427211 -0.2016613 -0.7761809 1.0000000 0.7072750
#> typewc 0.3483203 -0.1997770 -0.5592417 0.7072750 1.0000000
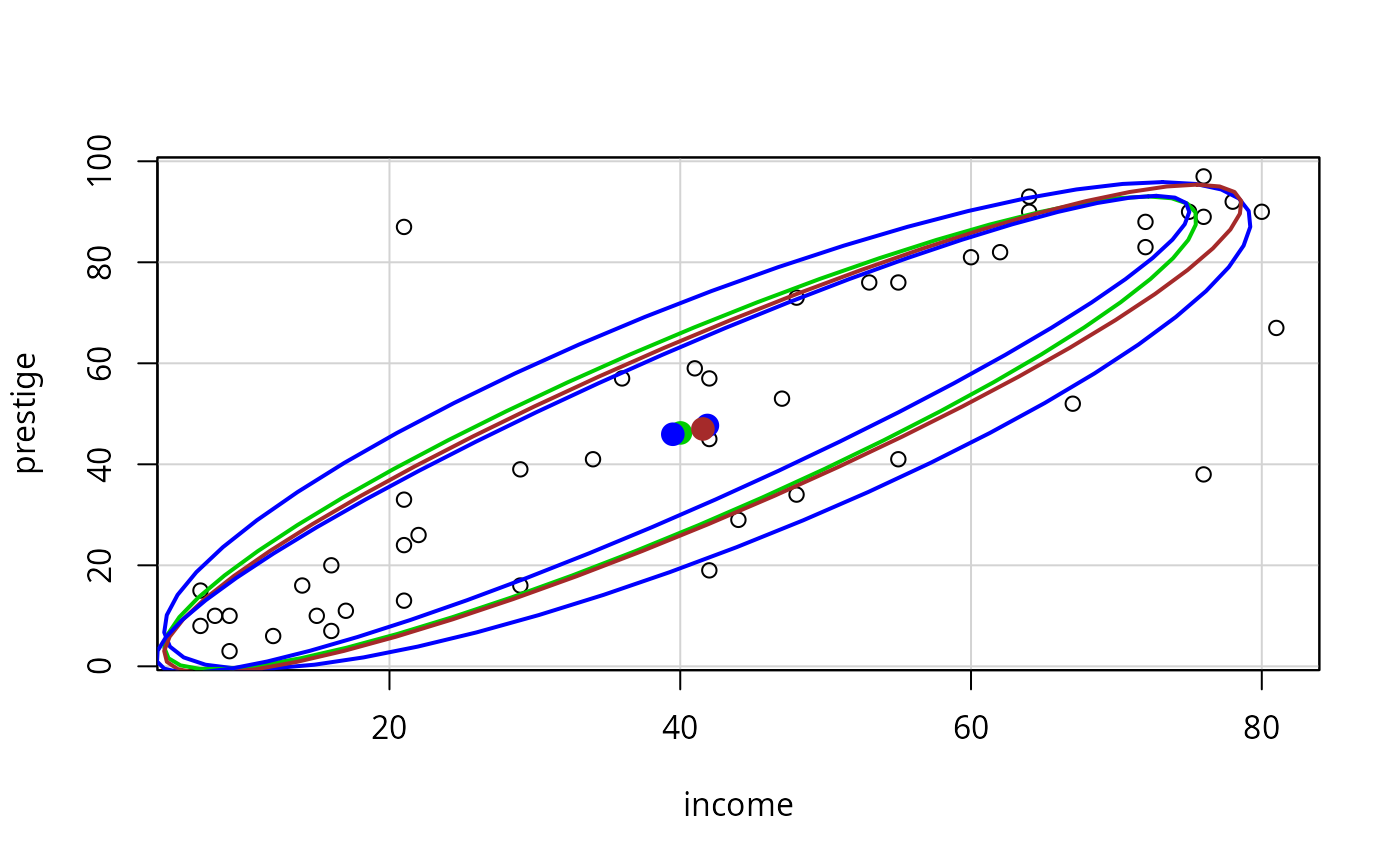
wts <- rep(1, nrow(Duncan))
wts[c(6, 16)] <- 0 # delete Minister, Conductor
with(Duncan, {
dataEllipse(income, prestige, levels=0.68)
dataEllipse(income, prestige, levels=0.68, robust=TRUE,
plot.points=FALSE, col="green3")
dataEllipse(income, prestige, weights=wts, levels=0.68,
plot.points=FALSE, col="brown")
dataEllipse(income, prestige, weights=wts, robust=TRUE, levels=0.68,
plot.points=FALSE, col="blue")
})
cov2cor(vcov(lm(prestige ~ income + education + type,
data=Duncan))) # correlations among coefficients
#> (Intercept) income education typeprof typewc
#> (Intercept) 1.0000000 -0.3484661 -0.6102747 0.5427211 0.3483203
#> income -0.3484661 1.0000000 -0.2880828 -0.2016613 -0.1997770
#> education -0.6102747 -0.2880828 1.0000000 -0.7761809 -0.5592417
#> typeprof 0.5427211 -0.2016613 -0.7761809 1.0000000 0.7072750
#> typewc 0.3483203 -0.1997770 -0.5592417 0.7072750 1.0000000
wts <- rep(1, nrow(Duncan))
wts[c(6, 16)] <- 0 # delete Minister, Conductor
with(Duncan, {
dataEllipse(income, prestige, levels=0.68)
dataEllipse(income, prestige, levels=0.68, robust=TRUE,
plot.points=FALSE, col="green3")
dataEllipse(income, prestige, weights=wts, levels=0.68,
plot.points=FALSE, col="brown")
dataEllipse(income, prestige, weights=wts, robust=TRUE, levels=0.68,
plot.points=FALSE, col="blue")
})
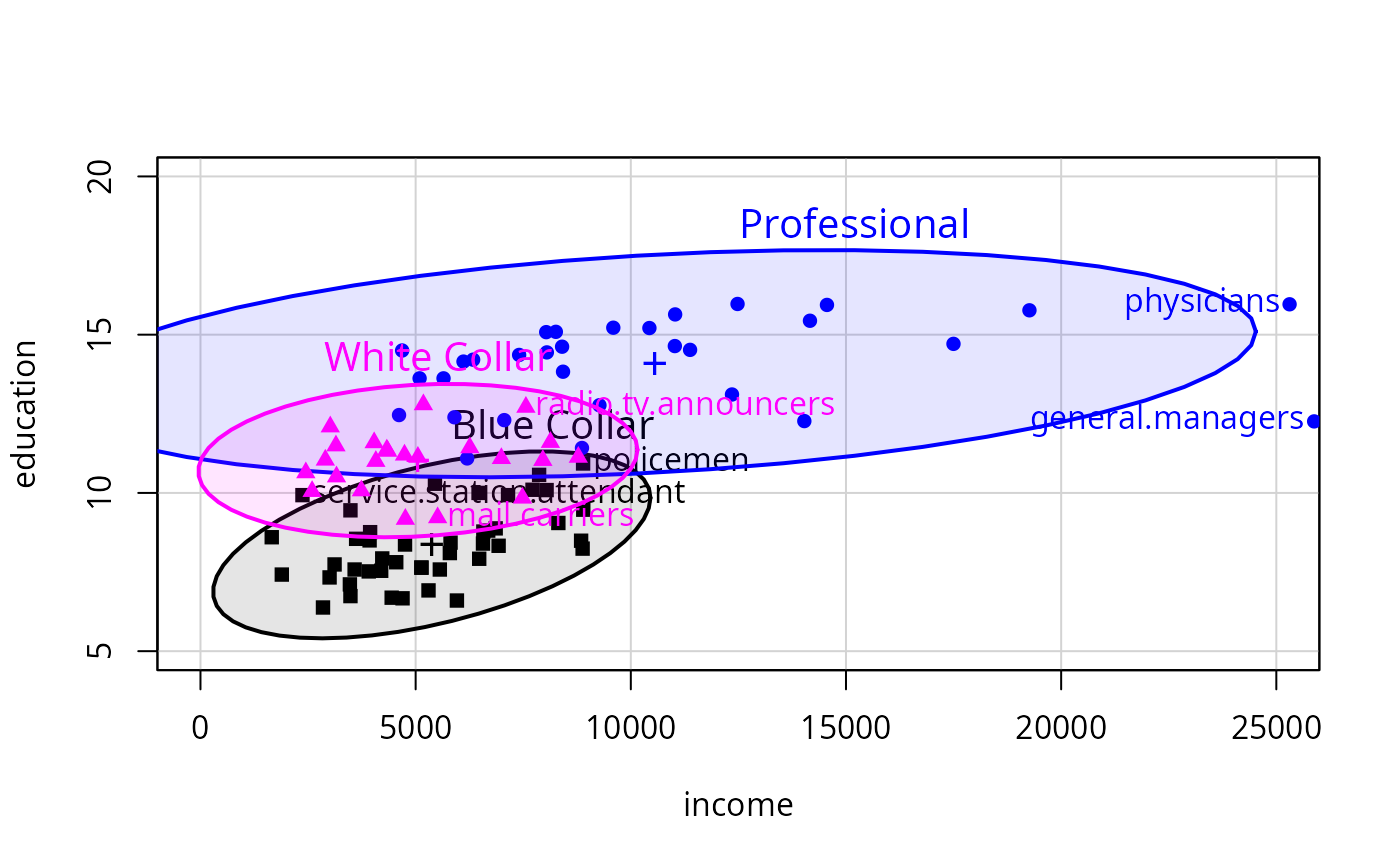
 with(Prestige, dataEllipse(income, education, type,
id=list(n=2, labels=rownames(Prestige)), pch=15:17,
xlim=c(0, 25000), center.pch="+",
group.labels=c("Blue Collar", "Professional", "White Collar"),
ylim=c(5, 20), level=.95, fill=TRUE, fill.alpha=0.1))
with(Prestige, dataEllipse(income, education, type,
id=list(n=2, labels=rownames(Prestige)), pch=15:17,
xlim=c(0, 25000), center.pch="+",
group.labels=c("Blue Collar", "Professional", "White Collar"),
ylim=c(5, 20), level=.95, fill=TRUE, fill.alpha=0.1))