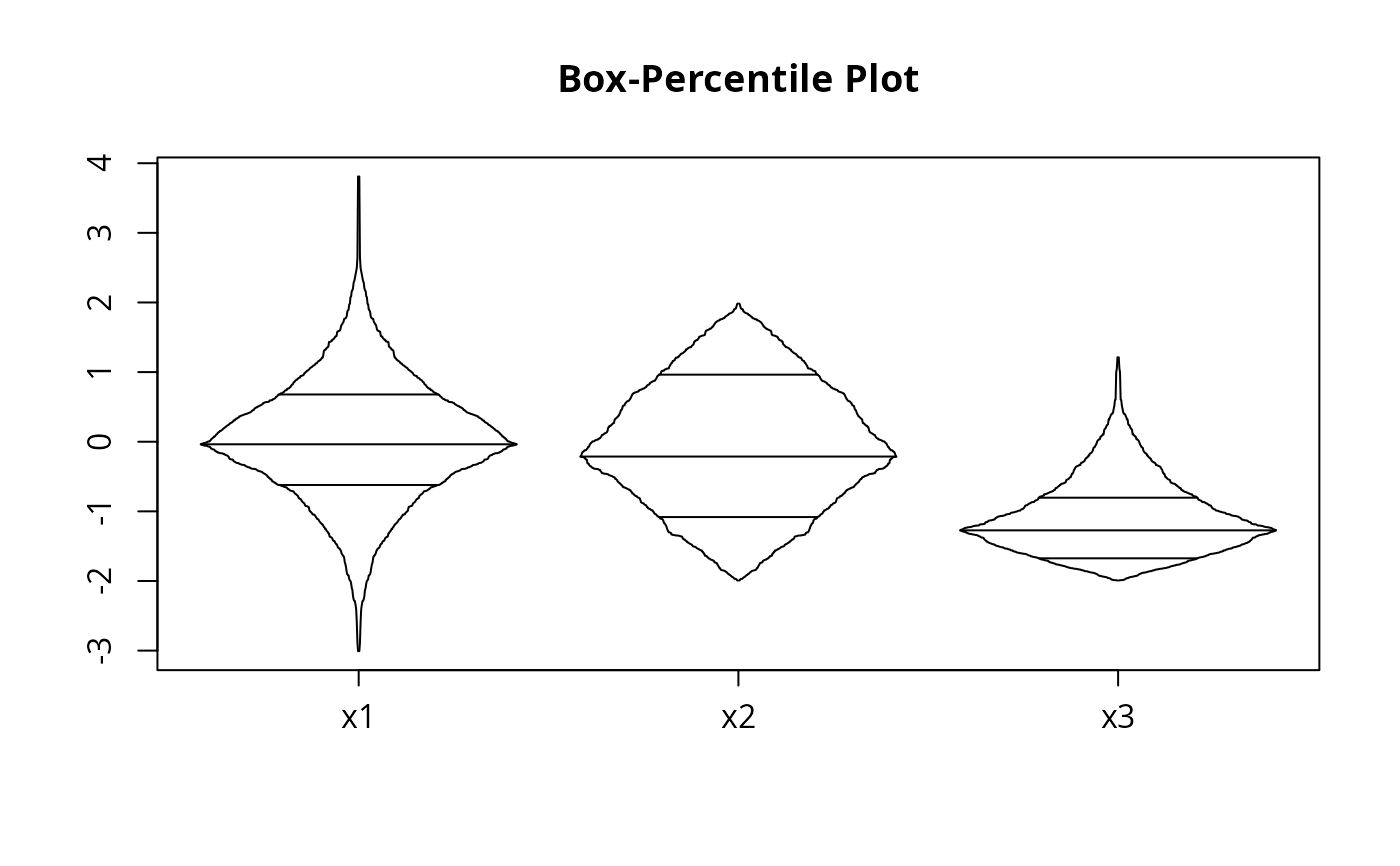
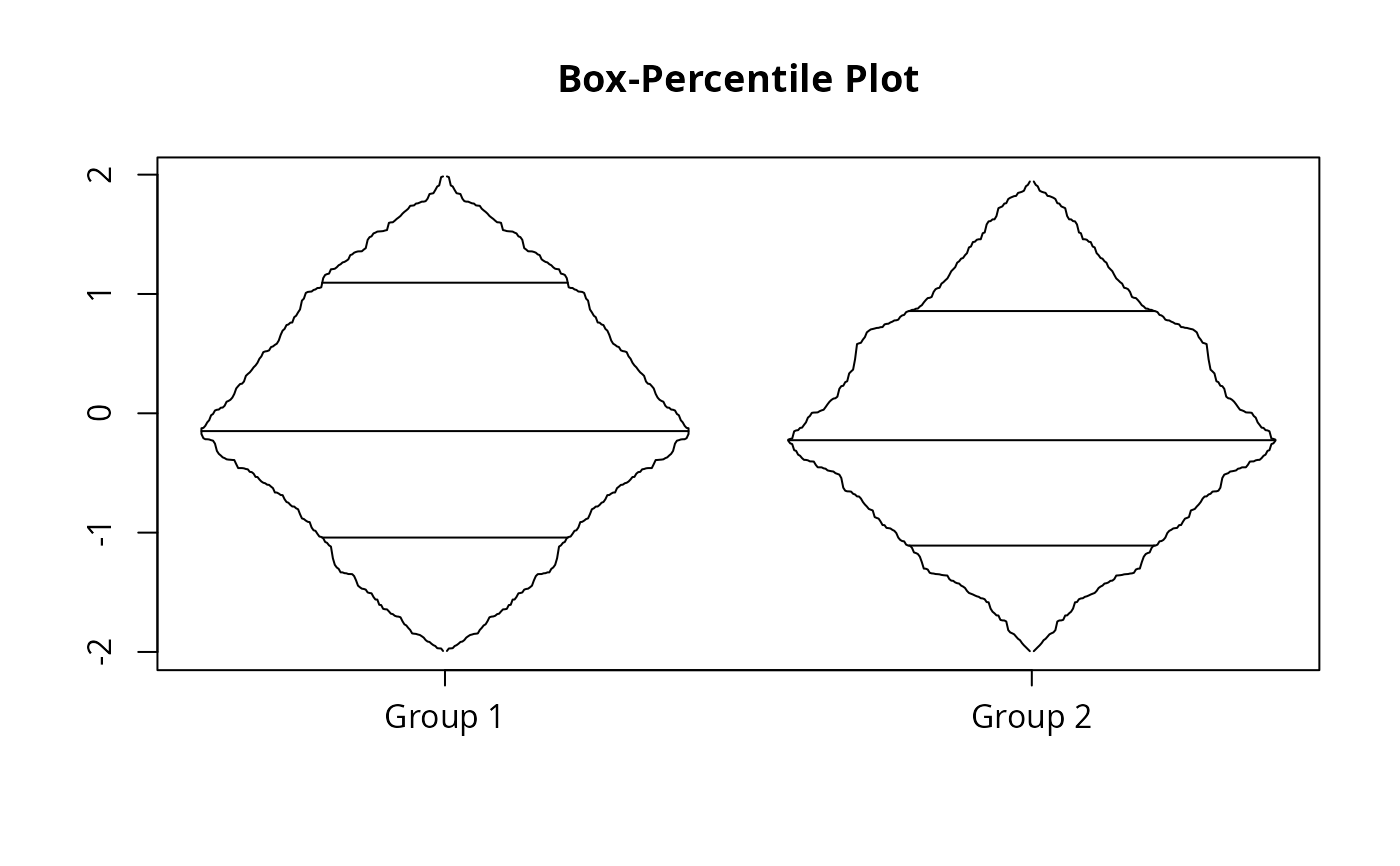
Box-percentile plots
bpplot.RdProducess side-by-side box-percentile plots from several vectors or a list of vectors.
Arguments
- ...
vectors or lists containing numeric components (e.g., the output of
split).- name
character vector of names for the groups. Default is
TRUEto put names on the x-axis. Such names are taken from the data vectors or thenamesattribute of the first argument if it is a list. SetnametoFALSEto suppress names. If a character vector is supplied the names in the vector are used to label the groups.- main
main title for the plot.
- xlab
x axis label.
- ylab
y axis label.
- srtx
rotation angle for x-axis labels. Default is zero.
- plotopts
a list of other parameters to send to
plot
BACKGROUND
Box-percentile plots are similiar to boxplots, except box-percentile plots supply more information about the univariate distributions. At any height the width of the irregular "box" is proportional to the percentile of that height, up to the 50th percentile, and above the 50th percentile the width is proportional to 100 minus the percentile. Thus, the width at any given height is proportional to the percent of observations that are more extreme in that direction. As in boxplots, the median, 25th and 75th percentiles are marked with line segments across the box.
Author
Jeffrey Banfield
umsfjban@bill.oscs.montana.edu
Modified by F. Harrell 30Jun97