Bivariate Summaries Computed Separately by a Series of Predictors
biVar.RdbiVar is a generic function that accepts a formula and usual
data, subset, and na.action parameters plus a
list statinfo that specifies a function of two variables to
compute along with information about labeling results for printing and
plotting. The function is called separately with each right hand side
variable and the same left hand variable. The result is a matrix of
bivariate statistics and the statinfo list that drives printing
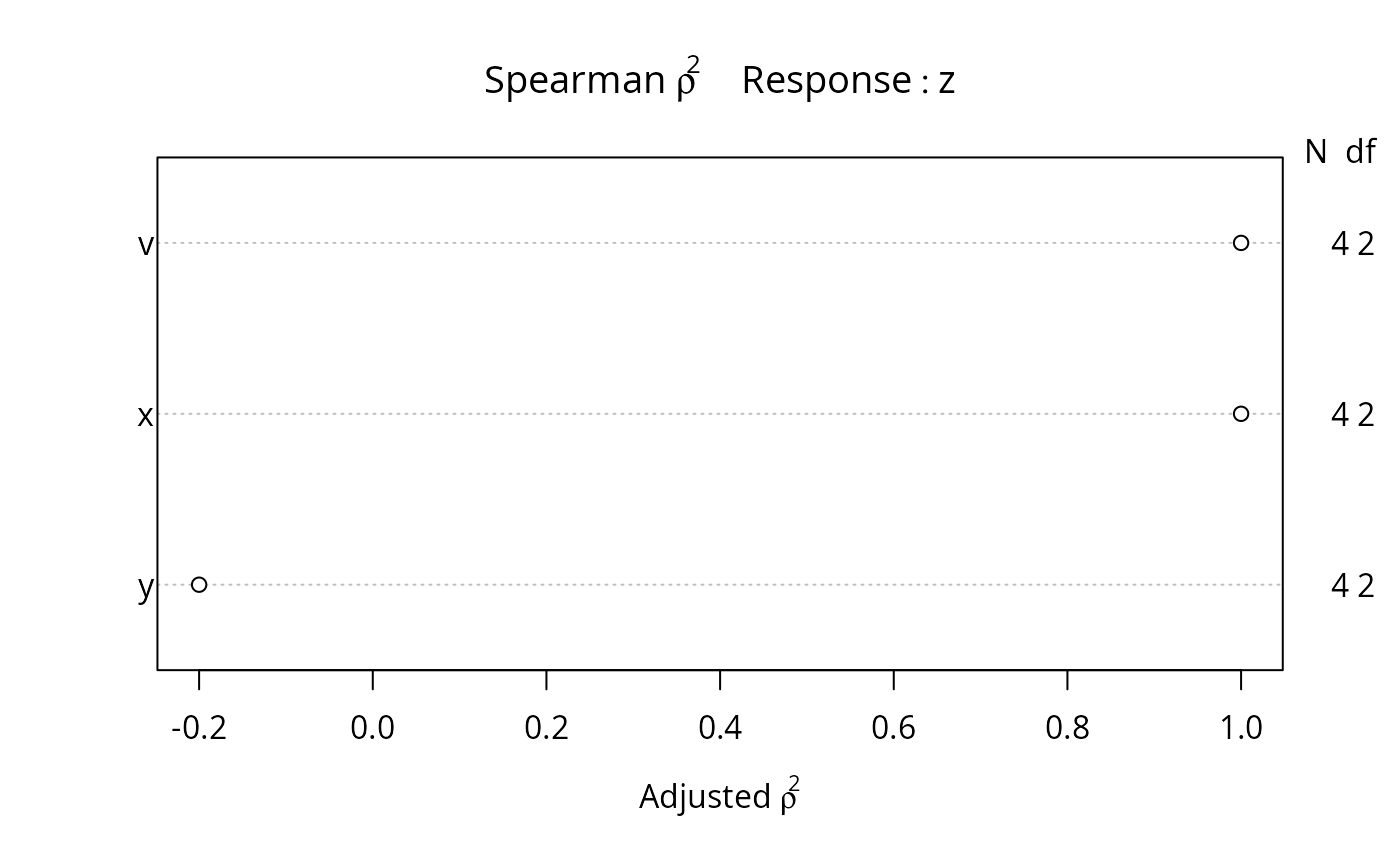
and plotting. The plot method draws a dot plot with x-axis values by
default sorted in order of one of the statistics computed by the function.
spearman2 computes the square of Spearman's rho rank correlation
and a generalization of it in which x can relate
non-monotonically to y. This is done by computing the Spearman
multiple rho-squared between (rank(x), rank(x)^2) and y.
When x is categorical, a different kind of Spearman correlation
used in the Kruskal-Wallis test is computed (and spearman2 can do
the Kruskal-Wallis test). This is done by computing the ordinary
multiple R^2 between k-1 dummy variables and
rank(y), where x has k categories. x can
also be a formula, in which case each predictor is correlated separately
with y, using non-missing observations for that predictor.
biVar is used to do the looping and bookkeeping. By default the
plot shows the adjusted rho^2, using the same formula used for
the ordinary adjusted R^2. The F test uses the unadjusted
R2.
spearman computes Spearman's rho on non-missing values of two
variables. spearman.test is a simple version of
spearman2.default.
chiSquare is set up like spearman2 except it is intended
for a categorical response variable. Separate Pearson chi-square tests
are done for each predictor, with optional collapsing of infrequent
categories. Numeric predictors having more than g levels are
categorized into g quantile groups. chiSquare uses
biVar.
Usage
biVar(formula, statinfo, data=NULL, subset=NULL,
      na.action=na.retain, exclude.imputed=TRUE, ...)

# S3 method for class 'biVar'
print(x, ...)

# S3 method for class 'biVar'
plot(x, what=info$defaultwhat,
                       sort.=TRUE, main, xlab,
                       vnames=c('names','labels'), ...)

spearman2(x, ...)

# Default S3 method
spearman2(x, y, p=1, minlev=0, na.rm=TRUE, exclude.imputed=na.rm, ...)

# S3 method for class 'formula'
spearman2(formula, data=NULL,
          subset, na.action=na.retain, exclude.imputed=TRUE, ...)

spearman(x, y)

spearman.test(x, y, p=1)

chiSquare(formula, data=NULL, subset=NULL, na.action=na.retain,
          exclude.imputed=TRUE, ...)
Arguments
- formula
a formula with a single left side variable
- statinfo
see
spearman2.formulaorchiSquarecode- data, subset, na.action
the usual options for models. Default for
na.actionis to retain all values, NA or not, so that NAs can be deleted in only a pairwise fashion.- exclude.imputed
set to
FALSEto include imputed values (created byimpute) in the calculations.- ...
other arguments that are passed to the function used to compute the bivariate statistics or to
dotchart3forplot.- na.rm
logical; delete NA values?
- x
a numeric matrix with at least 5 rows and at least 2 columns (if
yis absent). Forspearman2, the first argument may be a vector of any type, including character or factor. The first argument may also be a formula, in which case all predictors are correlated individually with the response variable.xmay be a formula forspearman2in which casespearman2.formulais invoked. Each predictor in the right hand side of the formula is separately correlated with the response variable. Forprintorplot,xis an object produced bybiVar. Forspearmanandspearman.testxis a numeric vector, as isy. ForchiSquare,xis a formula.
- y
a numeric vector
- p
for numeric variables, specifies the order of the Spearman
rho^2to use. The default isp=1to compute the ordinaryrho^2. Usep=2to compute the quadratic rank generalization to allow non-monotonicity.pis ignored for categorical predictors.- minlev
minimum relative frequency that a level of a categorical predictor should have before it is pooled with other categories (see
combine.levels) inspearman2andchiSquare(in which case it also applies to the response). The default,minlev=0causes no pooling.- what
specifies which statistic to plot. Possibilities include the column names that appear with the print method is used.
- sort.
set
sort.=FALSEto suppress sorting variables by the statistic being plotted- main
main title for plot. Default title shows the name of the response variable.
- xlab
x-axis label. Default constructed from
what.- vnames
set to
"labels"to use variable labels in place of names for plotting. If a variable does not have a label the name is always used.
Value
spearman2.default (the
function that is called for a single x, i.e., when there is no
formula) returns a vector of statistics for the variable.
biVar, spearman2.formula, and chiSquare return a
matrix with rows corresponding to predictors.
Details
Uses midranks in case of ties, as described by Hollander and Wolfe.
P-values for Spearman, Wilcoxon, or Kruskal-Wallis tests are
approximated by using the t or F distributions.
Author
Frank Harrell
Department of Biostatistics
Vanderbilt University
fh@fharrell.com
References
Hollander M. and Wolfe D.A. (1973). Nonparametric Statistical Methods. New York: Wiley.
Press WH, Flannery BP, Teukolsky SA, Vetterling, WT (1988): Numerical Recipes in C. Cambridge: Cambridge University Press.
Examples
x <- c(-2, -1, 0, 1, 2)
y <- c(4,   1, 0, 1, 4)
z <- c(1,   2, 3, 4, NA)
v <- c(1,   2, 3, 4, 5)

spearman2(x, y)
#>          rho2             F           df1           df2             P
#>     0.0000000     0.0000000     1.0000000     3.0000000     1.0000000
#>             n Adjusted rho2
#>     5.0000000    -0.3333333
plot(spearman2(z ~ x + y + v, p=2))


f <- chiSquare(z ~ x + y + v)
#> Warning: Chi-squared approximation may be incorrect
#> Warning: Chi-squared approximation may be incorrect
#> Warning: Chi-squared approximation may be incorrect
f
#>
#> Pearson Chi-square Tests    Response variable:z
#>
#>   chisquare df chisquare-df      P n
#> x         8  6            2 0.2381 4
#> y         8  6            2 0.2381 4
#> v         8  6            2 0.2381 4
f <- chiSquare(z ~ x + y + v)
#> Warning: Chi-squared approximation may be incorrect
#> Warning: Chi-squared approximation may be incorrect
#> Warning: Chi-squared approximation may be incorrect
f
#>
#> Pearson Chi-square Tests Response variable:z
#>
#> chisquare df chisquare-df P n
#> x 8 6 2 0.2381 4
#> y 8 6 2 0.2381 4
#> v 8 6 2 0.2381 4