Visually compare two dataframes and see where they are different.
Source:R/vis-compare.R
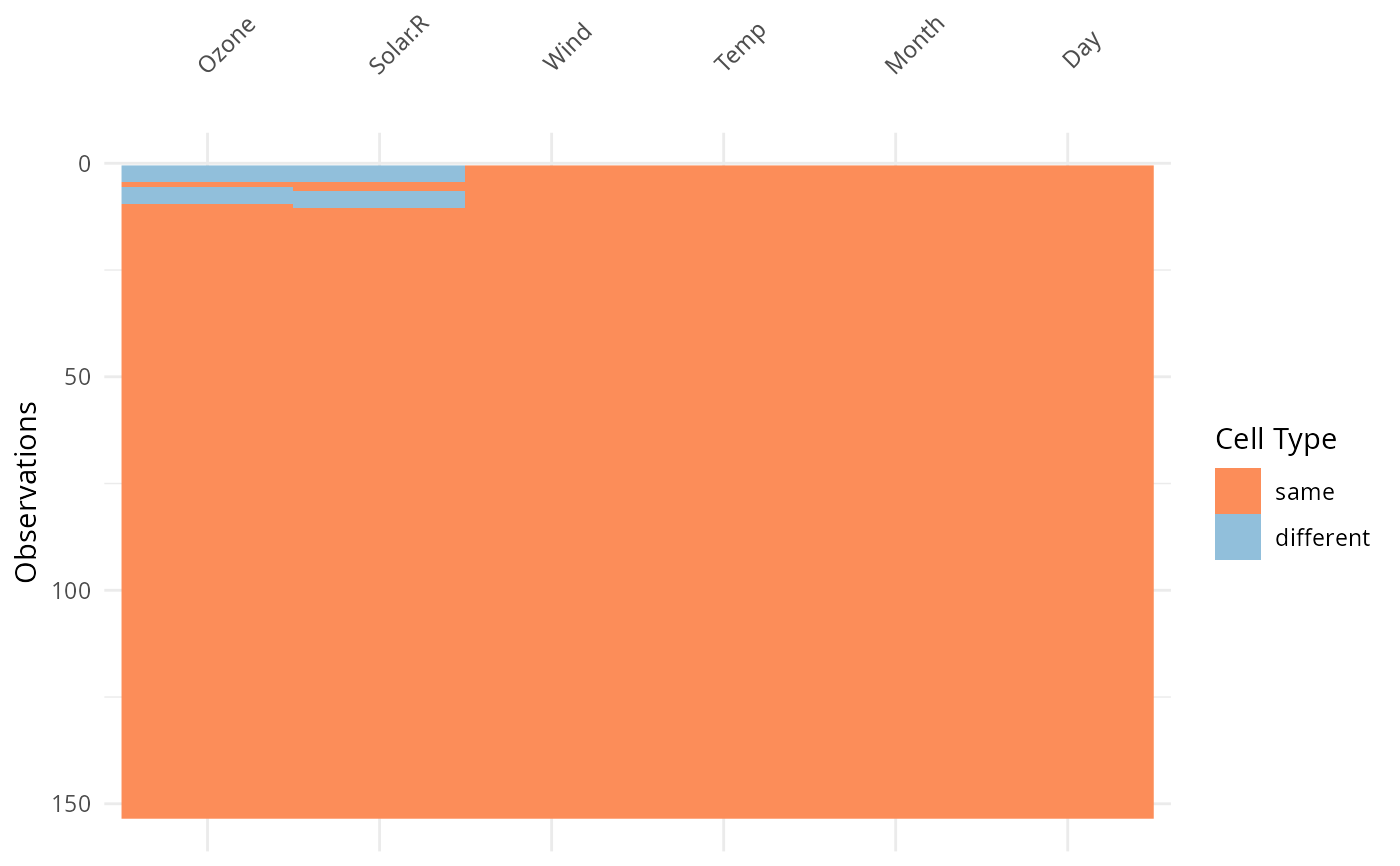
vis_compare.Rdvis_compare, like the other vis_* families, gives an at-a-glance ggplot
of a dataset, but in this case, hones in on visualising two different
dataframes of the same dimension, so it takes two dataframes as arguments.
vis_compare(df1, df2)Value
ggplot2 object displaying which values in each data frame are
present in each other, and which are not.
See also
Examples
# make a new dataset of iris that contains some NA values
aq_diff <- airquality
aq_diff[1:10, 1:2] <- NA
vis_compare(airquality, aq_diff)