Visualise correlations amongst variables in your data as a heatmap
vis_cor(
  data,
  cor_method = "pearson",
  na_action = "pairwise.complete.obs",
  facet,
  ...
)
Arguments
- data
data.frame
- cor_method
correlation method to use, from
cor: "a character string indicating which correlation coefficient (or covariance) is to be computed. One of "pearson" (default), "kendall", or "spearman": can be abbreviated."- na_action
The method for computing covariances when there are missing values present. This can be "everything", "all.obs", "complete.obs", "na.or.complete", or "pairwise.complete.obs" (default). This option is taken from the
corfunction argumentuse.,- facet
bare unqouted variable to use for facetting
- ...
extra arguments you may want to pass to
cor
Value
ggplot2 object
Examples
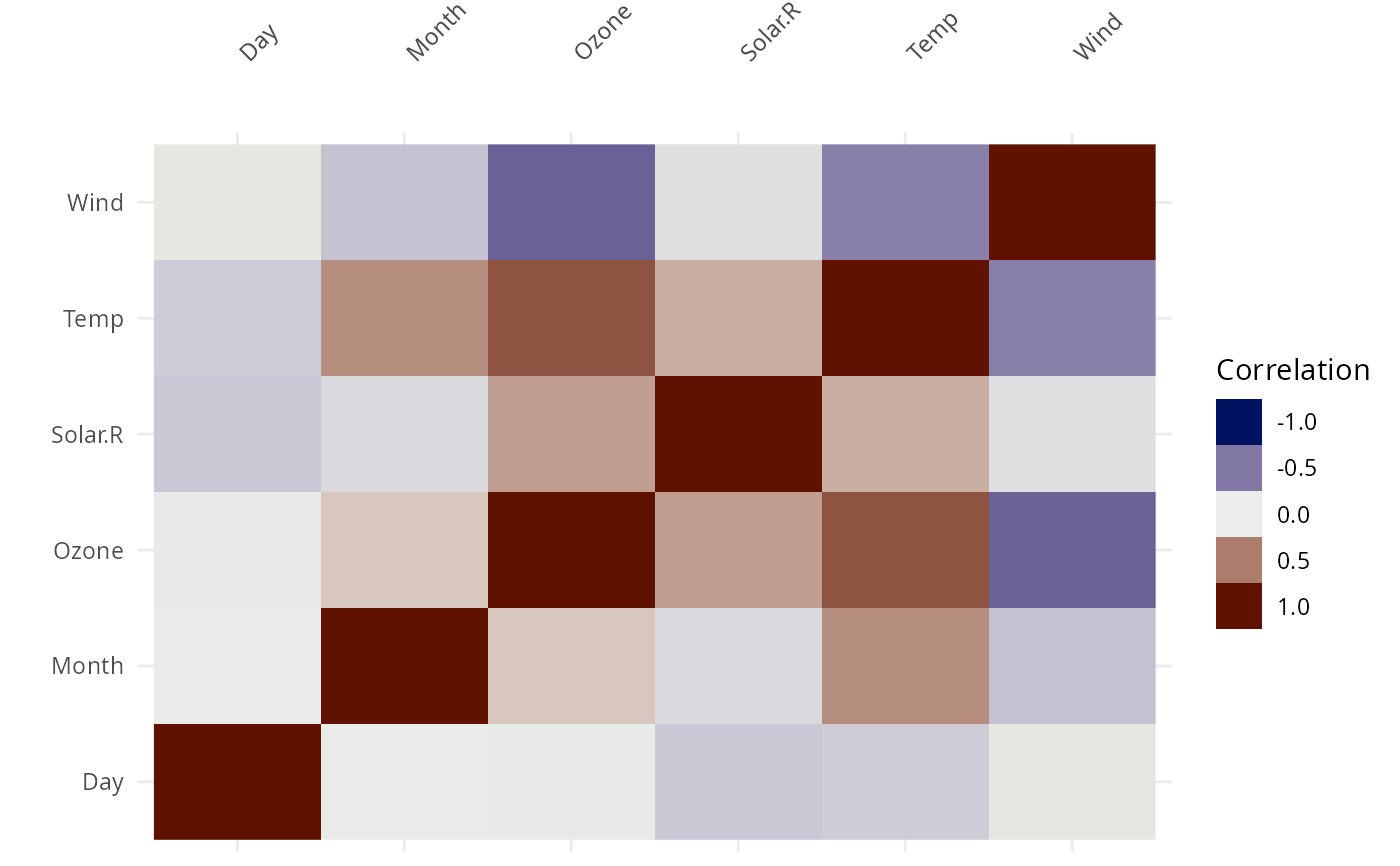
vis_cor(airquality)
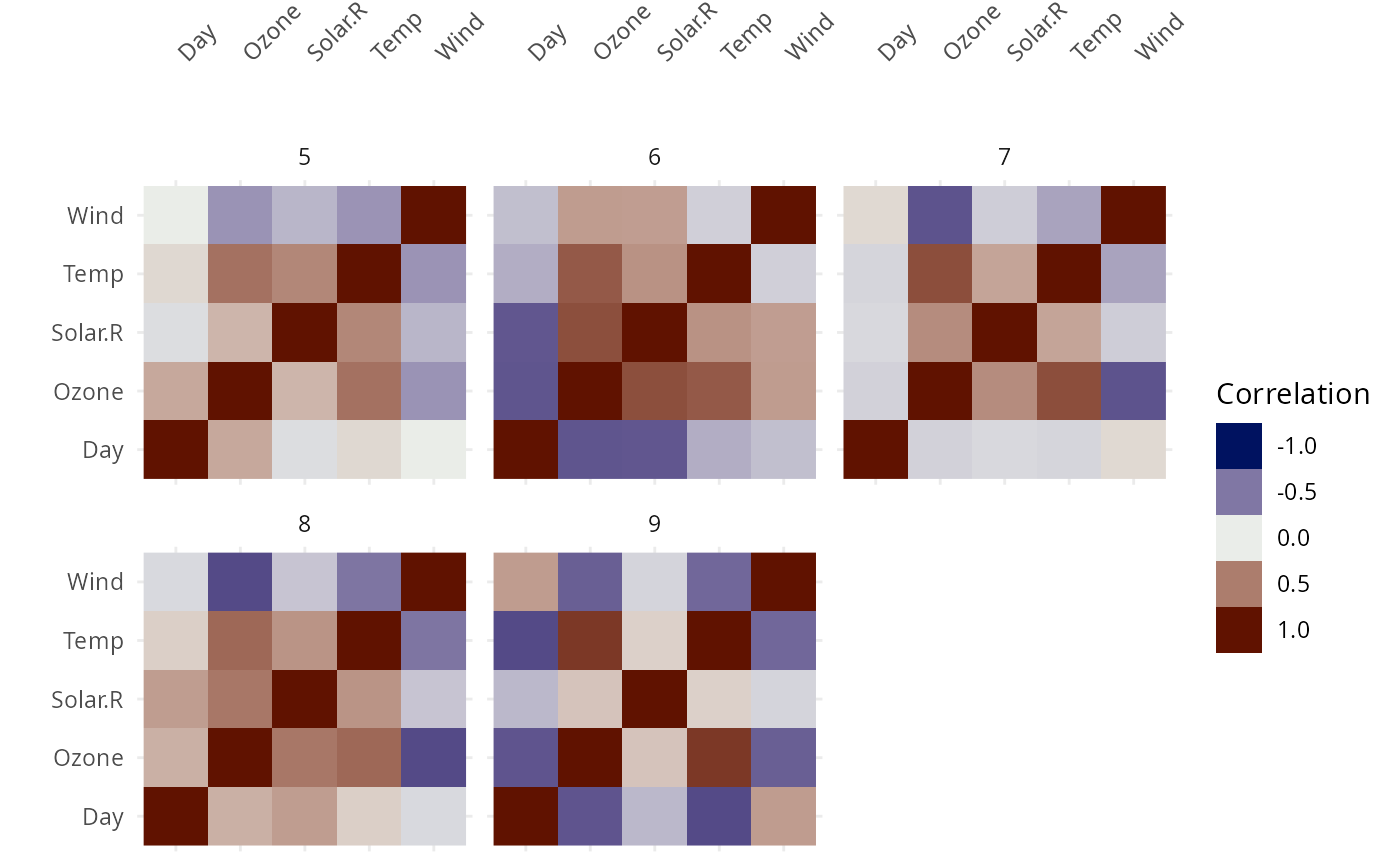
 vis_cor(airquality, facet = Month)
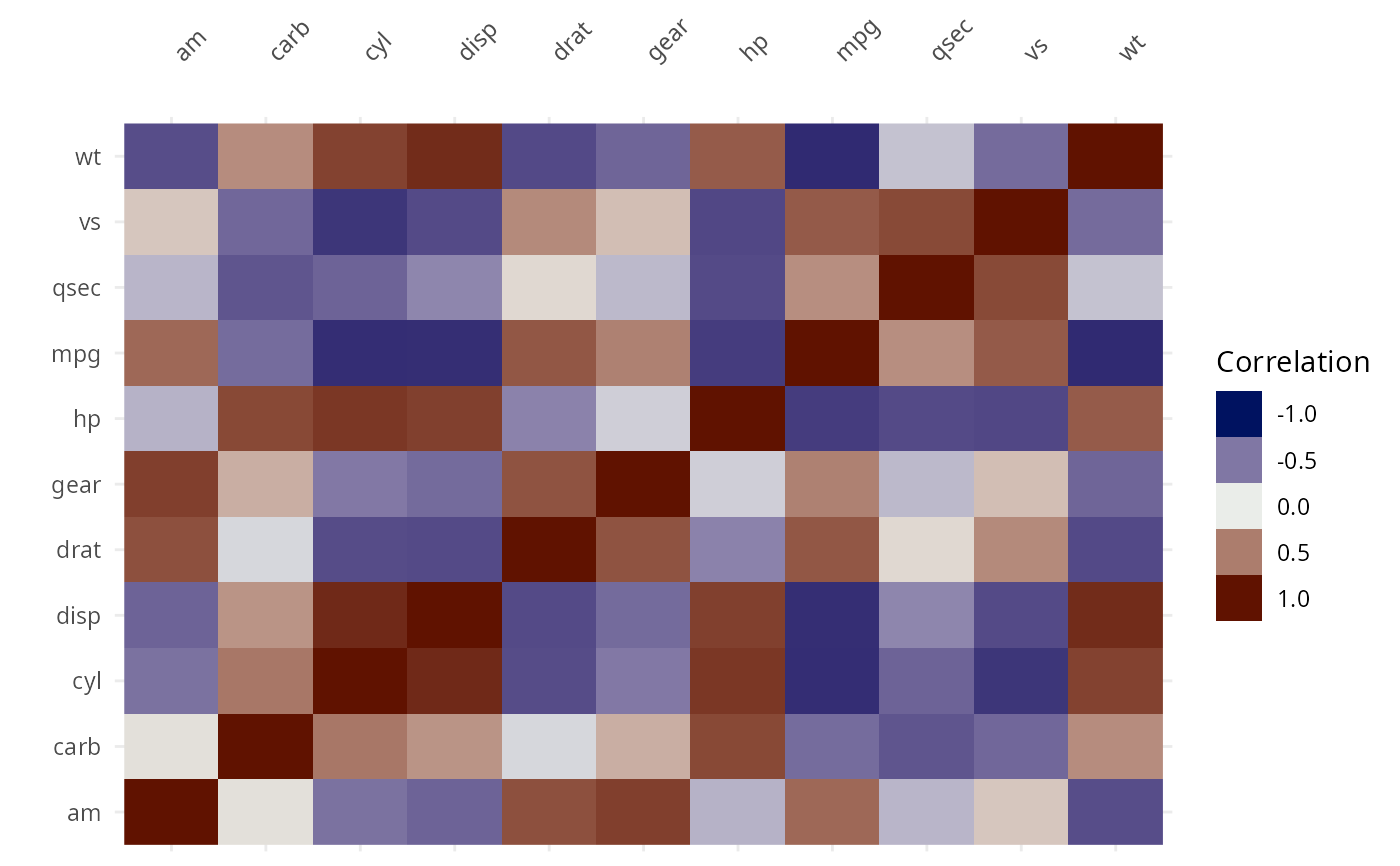
 vis_cor(mtcars)
 if (FALSE) { # \dontrun{
# this will error
vis_cor(iris)
} # }
if (FALSE) { # \dontrun{
# this will error
vis_cor(iris)
} # }