Sex is Fun
SexualFun.RdData from Hout et al. (1987) given by Agresti (1990) summarizing the responses of married couples to the questionnaire item: Sex is fun for me and my partner: (a) never or occasionally, (b) fairly often, (c) very often, (d) almost always.
data("SexualFun")Format
A 2-dimensional array resulting from cross-tabulating the ratings of 91 married couples. The variables and their levels are as follows:
| No | Name | Levels |
| 1 | Husband | Never Fun, Fairly Often, Very Often, Always Fun |
| 2 | Wife | Never Fun, Fairly Often, Very Often, Always Fun |
References
A. Agresti (1990), Categorical Data Analysis. Wiley-Interscience, New York.
M. Hout, O. D. Duncan, M. E. Sobel (1987), Association and heterogeneity: Structural models of similarities and differences, Sociological Methodology, 17, 145-184.
M. Friendly (2000), Visualizing Categorical Data. SAS Institute, Cary, NC.
Source
M. Friendly (2000), Visualizing Categorical Data, page 91.
Examples
data("SexualFun")
## Kappa statistics
Kappa(SexualFun)
#> value ASE z Pr(>|z|)
#> Unweighted 0.1293 0.06860 1.885 0.059387
#> Weighted 0.2374 0.07832 3.031 0.002437
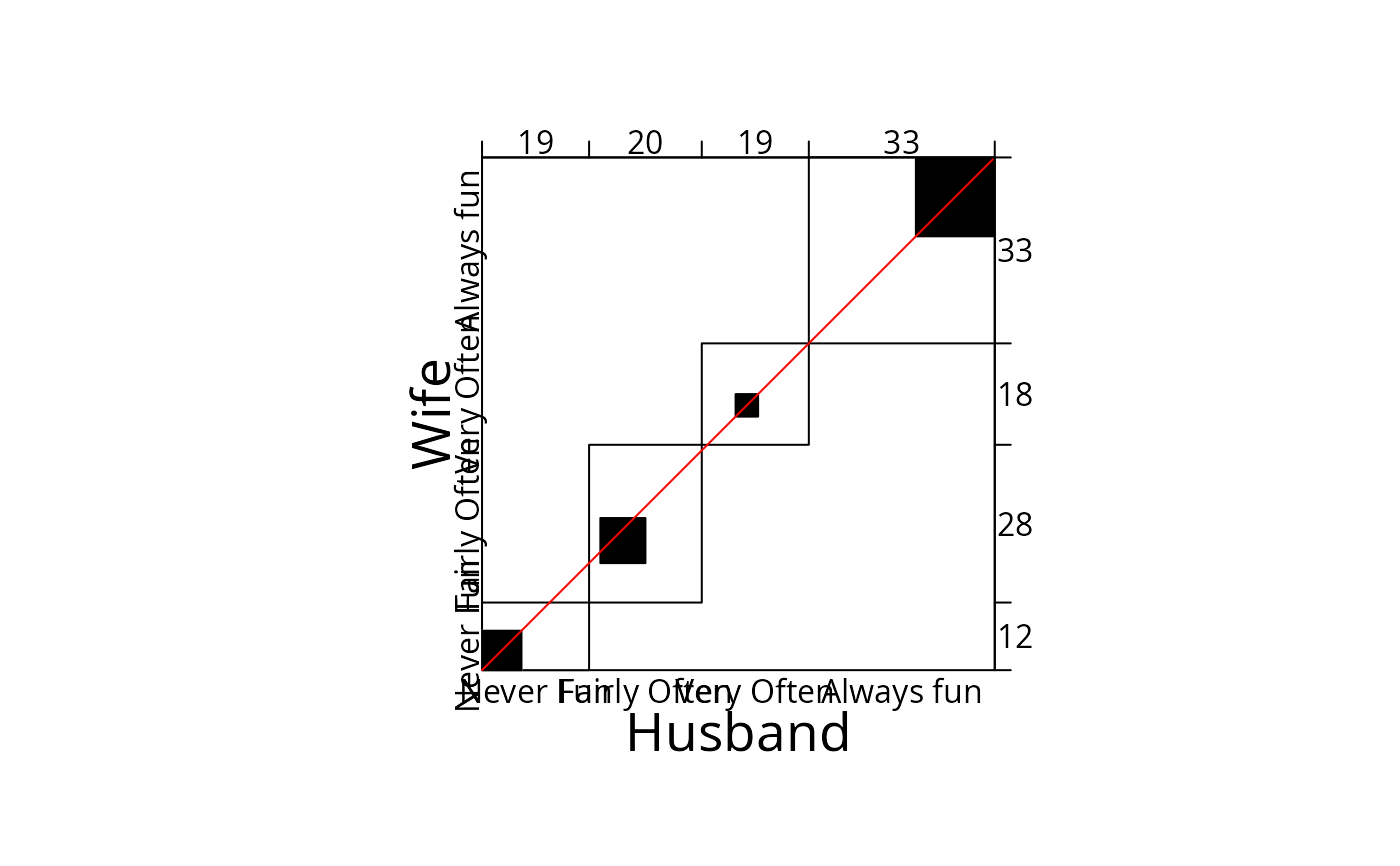
## Agreement Chart
agreementplot(t(SexualFun), weights = 1)
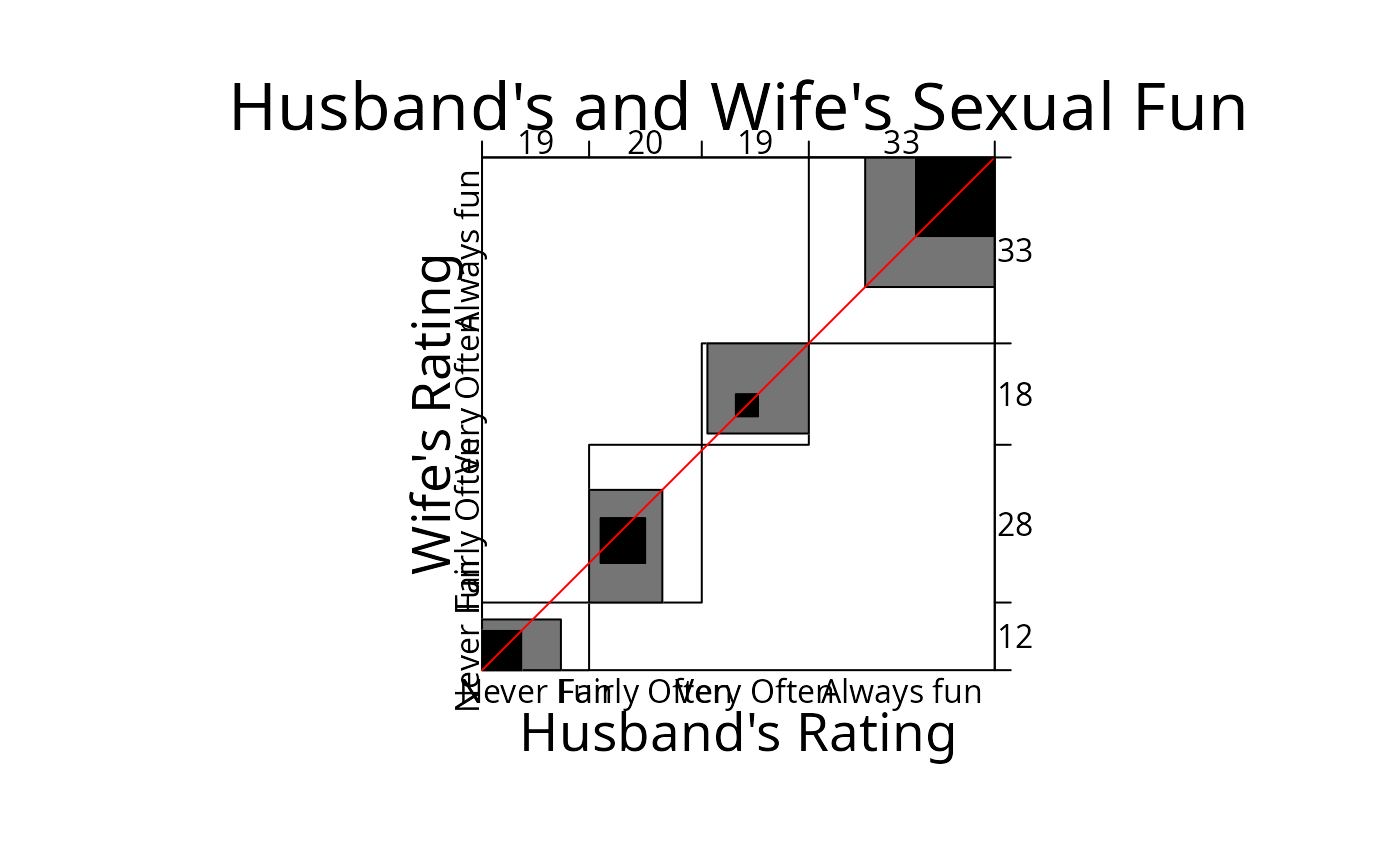
 ## Partial Agreement Chart and B-Statistics
agreementplot(t(SexualFun),
xlab = "Husband's Rating",
ylab = "Wife's Rating",
main = "Husband's and Wife's Sexual Fun")
## Partial Agreement Chart and B-Statistics
agreementplot(t(SexualFun),
xlab = "Husband's Rating",
ylab = "Wife's Rating",
main = "Husband's and Wife's Sexual Fun")