Diagnosis of Multiple Sclerosis
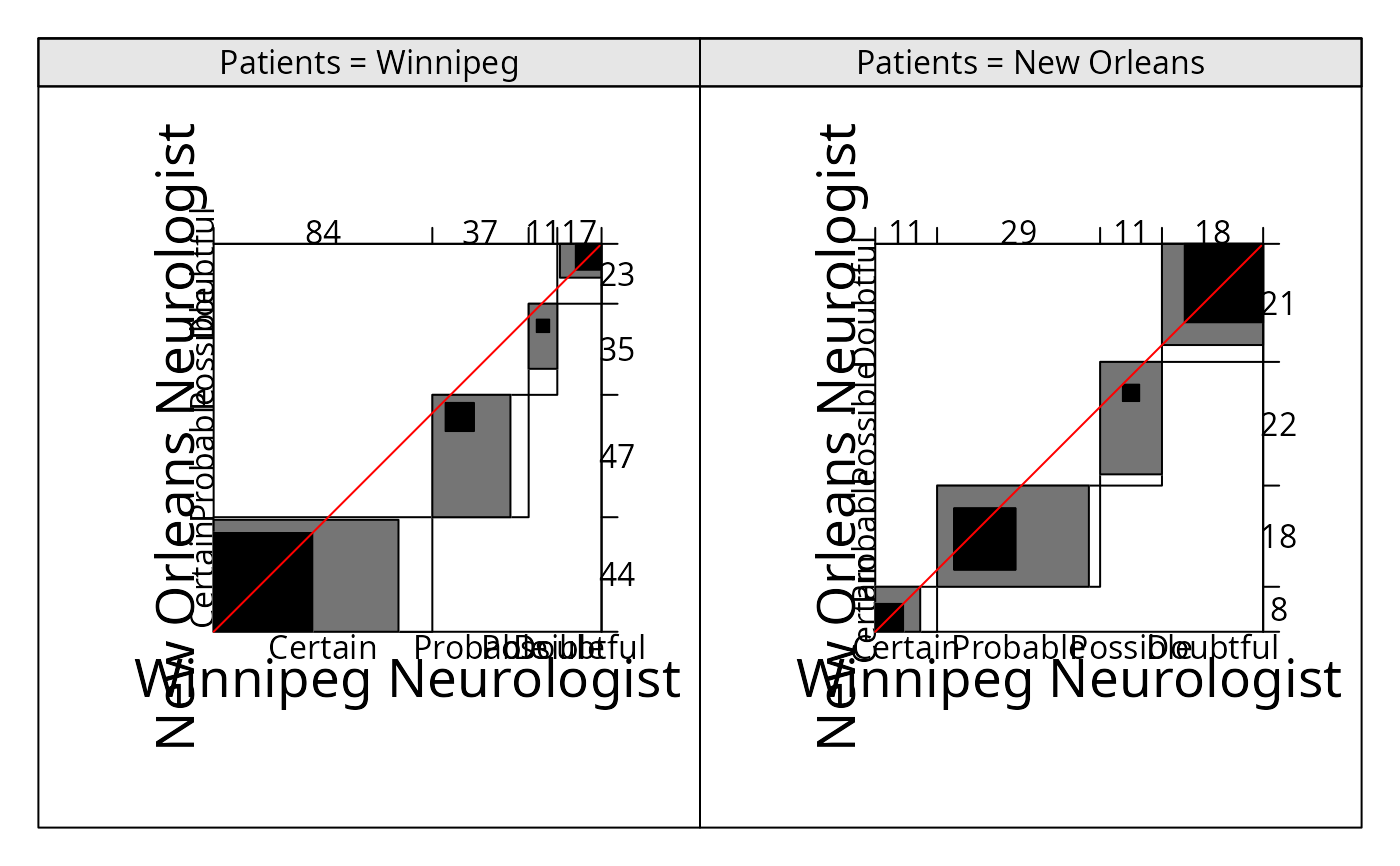
MSPatients.RdData from Westlund & Kurland (1953) on the diagnosis of multiple sclerosis (MS): two samples of patients, one from Winnipeg and one from New Orleans, were each rated by two neurologists (one from each city) in four diagnostic categories.
data("MSPatients")Format
A 3-dimensional array resulting from cross-tabulating 218 observations on 3 variables. The variables and their levels are as follows:
| No | Name | Levels |
| 1 | New Orleans Neurologist | Certain, Probable, Possible, Doubtful |
| 2 | Winnipeg Neurologist | Certain, Probable, Possible, Doubtful |
| 3 | Patients | Winnipeg, New Orleans |
References
K. B. Westlund & L. T. Kurland (1953), Studies on multiple sclerosis in Winnipeg, Manitoba and New Orleans, Louisiana, American Journal of Hygiene, 57, 380–396.
M. Friendly (2000), Visualizing Categorical Data. SAS Institute, Cary, NC.
Source
M. Friendly (2000), Visualizing Categorical Data: http://euclid.psych.yorku.ca/ftp/sas/vcd/catdata/msdiag.sas
Examples
data("MSPatients")
if (FALSE) { # \dontrun{
## best visualized using a resized device, e.g. using:
## get(getOption("device"))(width = 12)
pushViewport(viewport(layout = grid.layout(ncol = 2)))
pushViewport(viewport(layout.pos.col = 1))
popViewport()
pushViewport(viewport(layout.pos.col = 2))
popViewport(2)
dev.off()
} # }
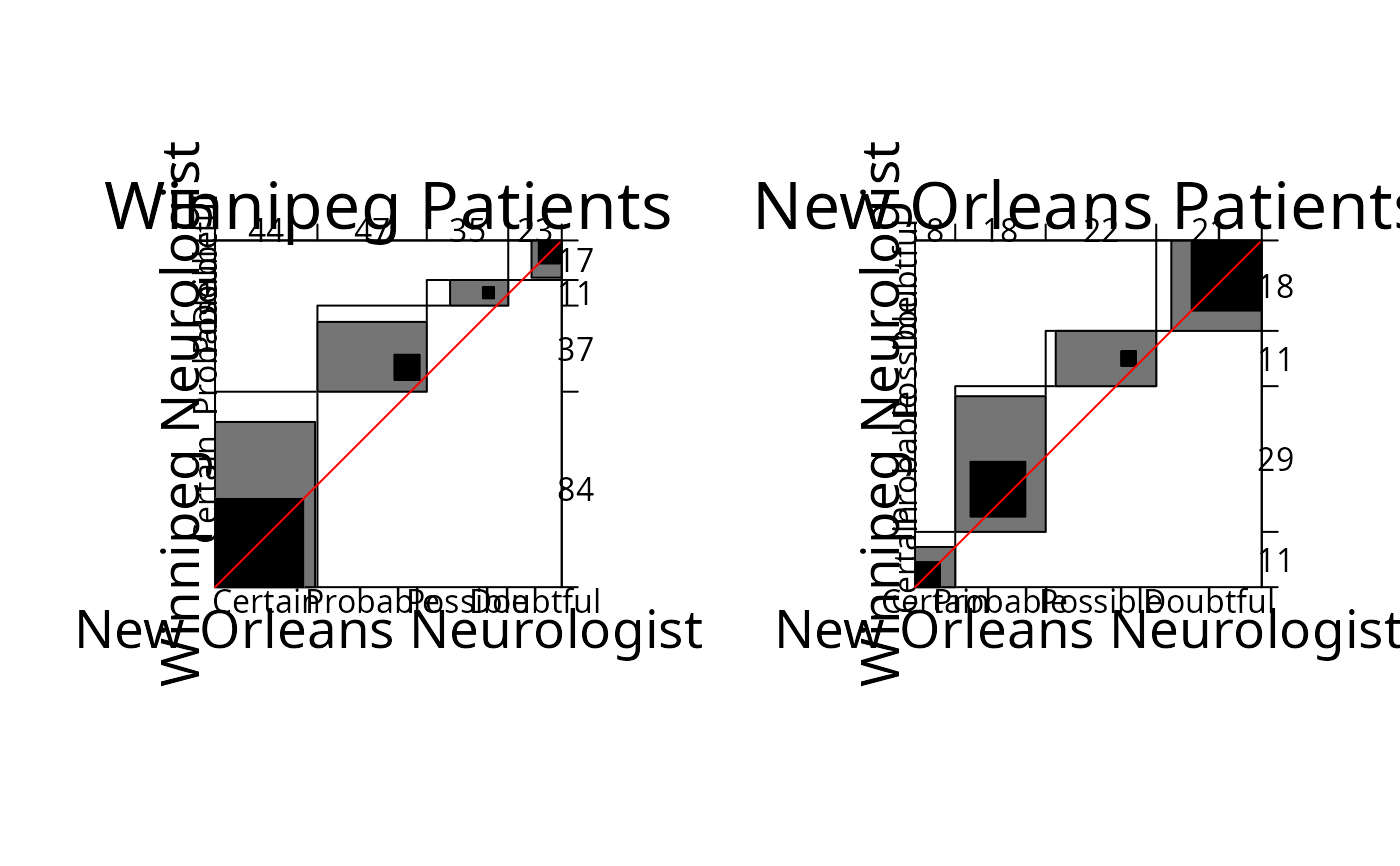
## alternative, more convenient way
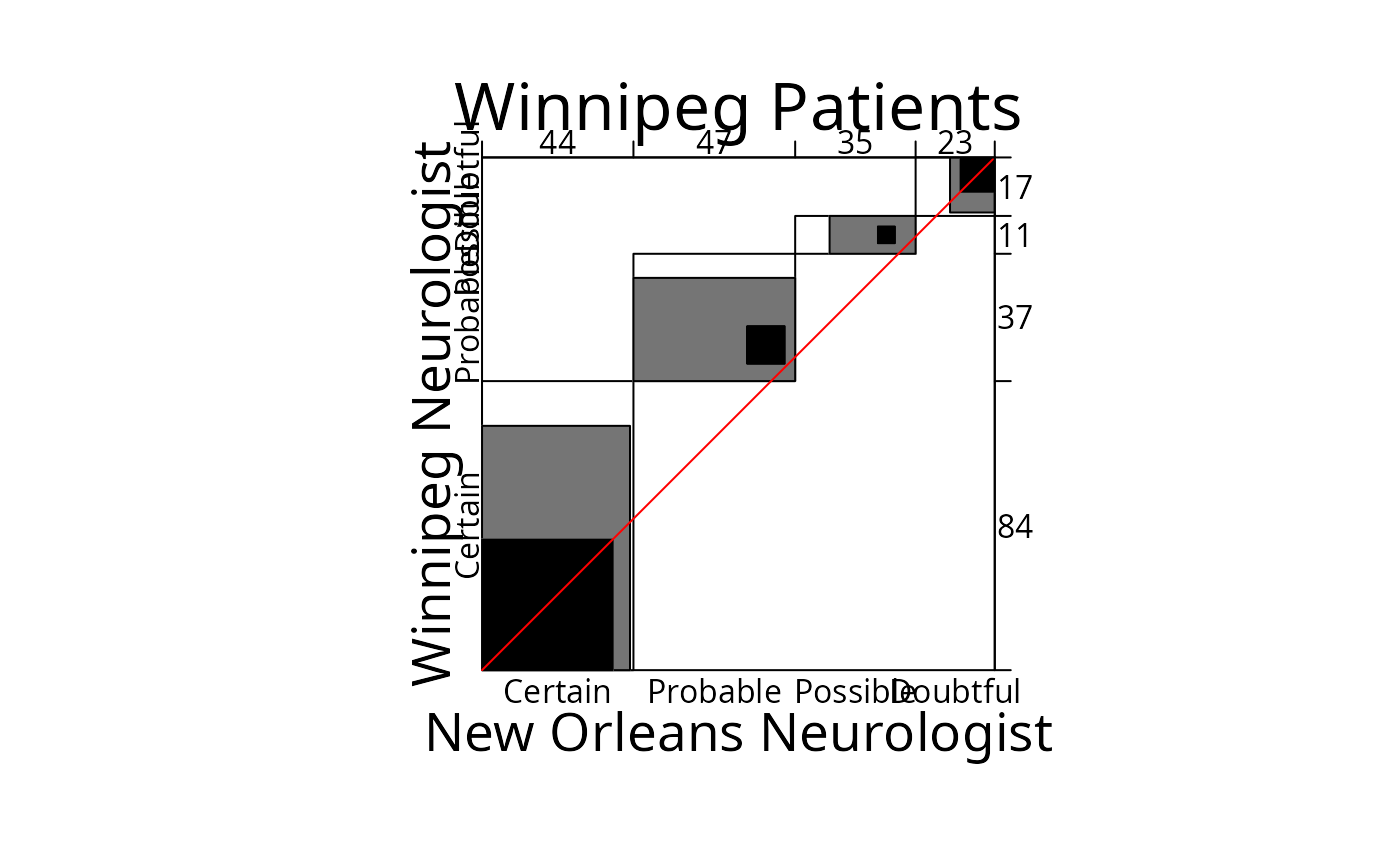
mplot(
agreementplot(t(MSPatients[,,1]), return_grob = TRUE,
main = "Winnipeg Patients"),
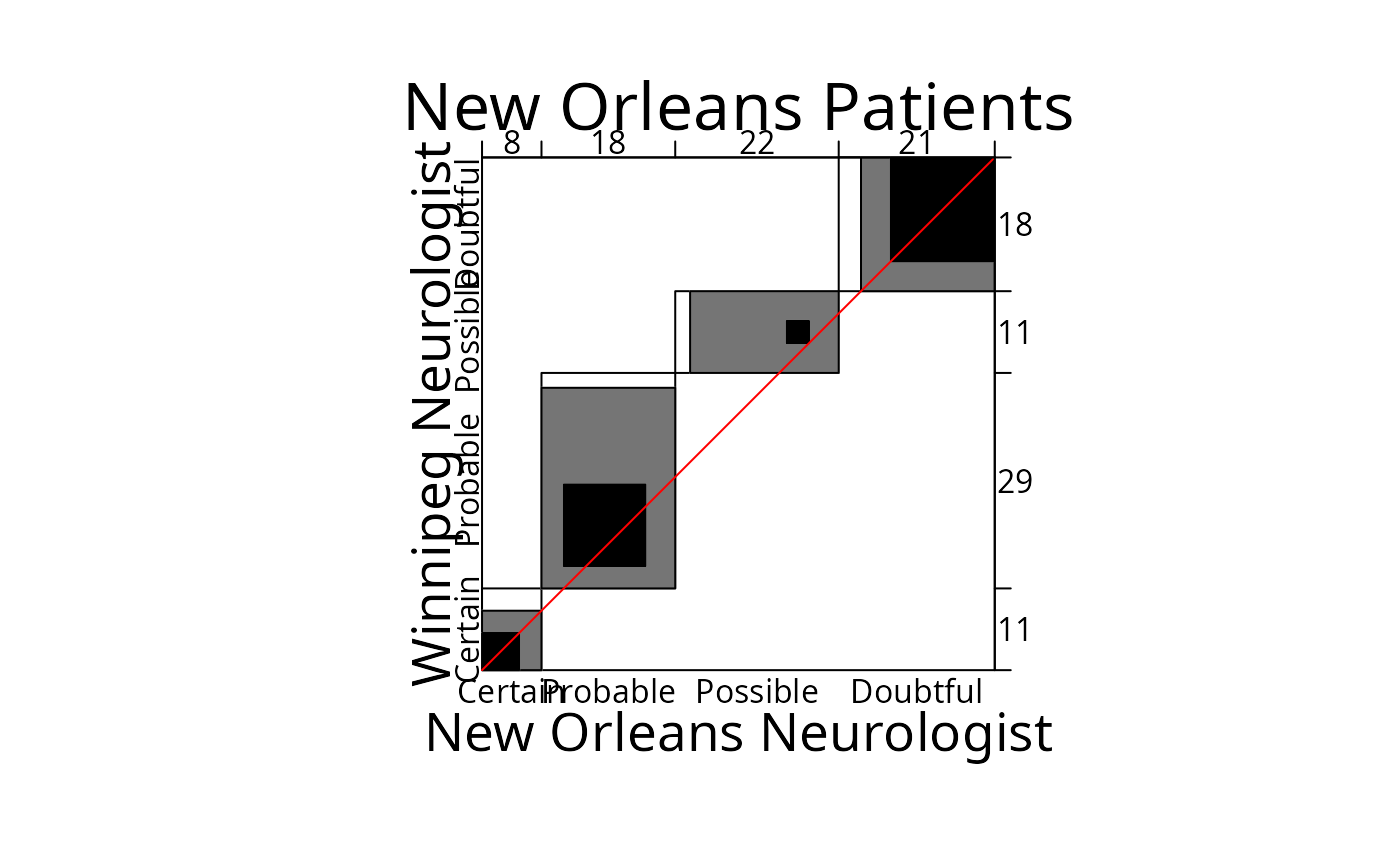
agreementplot(t(MSPatients[,,2]), return_grob = TRUE,
main = "New Orleans Patients")
)


 ## alternatively, use cotabplot:
cotabplot(MSPatients, panel = cotab_agreementplot)
## alternatively, use cotabplot:
cotabplot(MSPatients, panel = cotab_agreementplot)