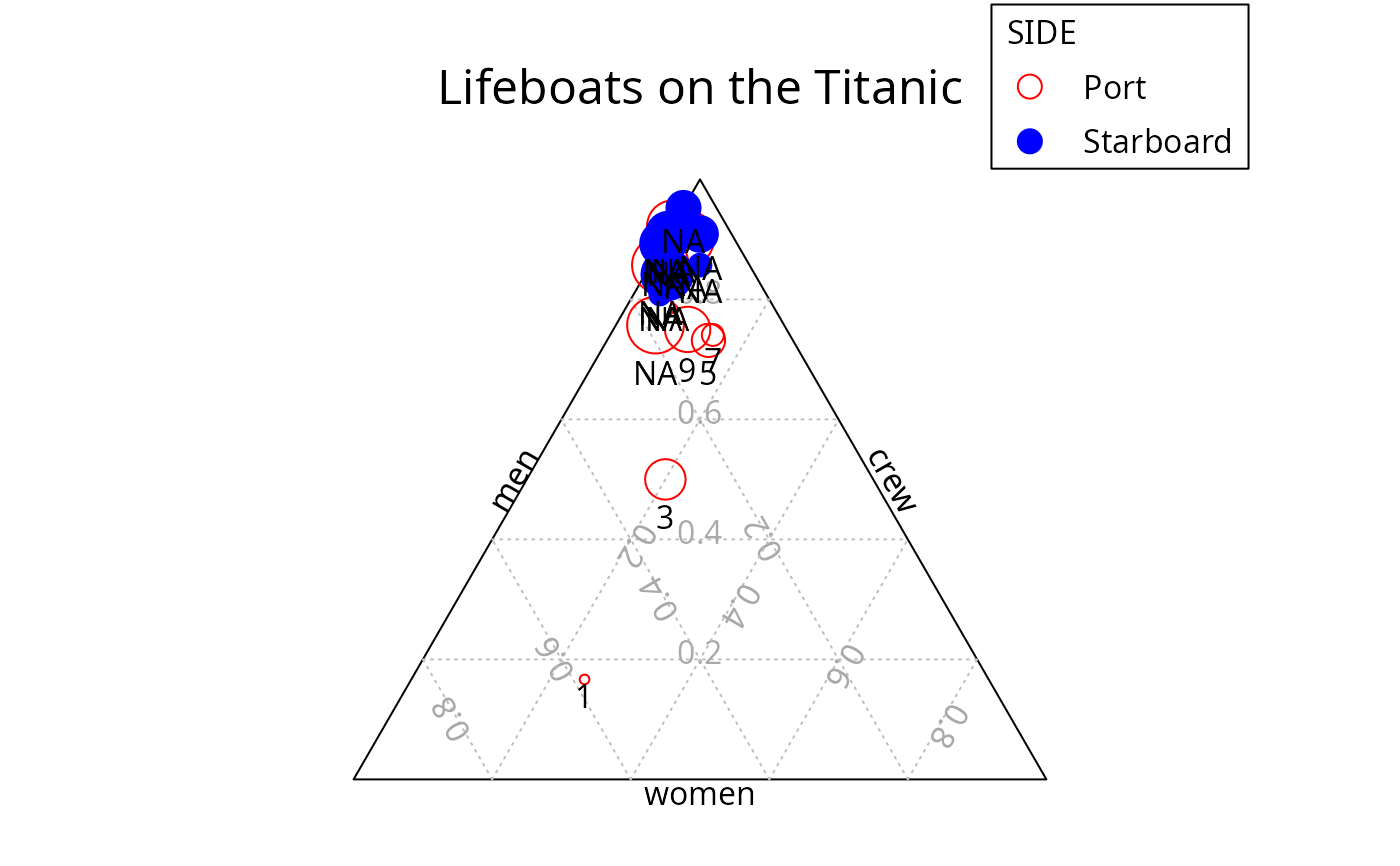
Lifeboats on the Titanic
Lifeboats.RdData from Mersey (1912) about the 18 (out of 20) lifeboats launched before the sinking of the S. S. Titanic.
data("Lifeboats")Format
A data frame with 18 observations and 8 variables.
- launch
launch time in
"POSIXt"format.- side
factor. Side of the boat.
- boat
factor indicating the boat.
- crew
number of male crew members on board.
- men
number of men on board.
- women
number of women (including female crew) on board.
- total
total number of passengers.
- cap
capacity of the boat.
References
L. Mersey (1912), Report on the loss of the “Titanic” (S. S.). Parliamentary command paper 6452.
M. Friendly (2000), Visualizing Categorical Data. SAS Institute, Cary, NC.
Source
M. Friendly (2000), Visualizing Categorical Data: http://euclid.psych.yorku.ca/ftp/sas/vcd/catdata/lifeboat.sas
Examples
data("Lifeboats")
attach(Lifeboats)
#> The following object is masked from package:datasets:
#>
#>     women
ternaryplot(
  Lifeboats[,4:6],
  pch = ifelse(side == "Port", 1, 19),
  col = ifelse(side == "Port", "red", "blue"),
  id  = ifelse(men / total > 0.1, as.character(boat), NA),
  prop_size = 2,
  dimnames_position = "edge",
  main = "Lifeboats on the Titanic"
)
grid_legend(0.8, 0.9, c(1, 19), c("red", "blue"),
  c("Port", "Starboard"), title = "SIDE")

detach(Lifeboats)