Ternary Diagram
ternaryplot.RdVisualizes compositional, 3-dimensional data in an equilateral triangle.
ternaryplot(x, scale = 1, dimnames = NULL,
  dimnames_position = c("corner","edge","none"),
  dimnames_color = "black", dimnames_rot = c(-60, 60, 0),
  id = NULL, id_color = "black",
  id_just = c("center", "center"),
  coordinates = FALSE, grid = TRUE, grid_color = "gray",
  labels = c("inside", "outside", "none"),
  labels_color = "darkgray", labels_rot = c(120, -120, 0),
  border = "black", bg = "white",
  pch = 19, cex = 1, prop_size = FALSE, col = "red",
  main = "ternary plot", newpage = TRUE, pop = TRUE,
  return_grob = FALSE, ...)
Arguments
- x
a matrix with three columns.
- scale
row sums scale to be used.
- dimnames
dimension labels (defaults to the column names of
x).- dimnames_position, dimnames_color
position and color of dimension labels.
- dimnames_rot
Numeric vector of length 3, specifying the angle of the dimension labels.
- id
optional labels to be plotted below the plot symbols.
coordinatesandidare mutual exclusive.- id_color
color of these labels.
- id_just
character vector of length 1 or 2 indicating the justification of these labels.
- coordinates
if
TRUE, the coordinates of the points are plotted below them.coordinatesandidare mutual exclusive.- grid
if
TRUE, a grid is plotted. May optionally be a string indicating the line type (default:"dotted").- grid_color
grid color.
- labels, labels_color
position and color of the grid labels.
- labels_rot
Numeric vector of length 3, specifying the angle of the grid labels.
- border
color of the triangle border.
- bg
triangle background.
- pch
plotting character. Defaults to filled dots.
- cex
a numerical value giving the amount by which plotting text and symbols should be scaled relative to the default. Ignored for the symbol size if
prop_sizeis notFALSE.- prop_size
if
TRUE, the symbol size is plotted proportional to the row sum of the three variables, i.e., represents the weight of the observation.- col
plotting color.
- main
main title.
- newpage
if
TRUE, the plot will appear on a new graphics page.- pop
logical; if
TRUE, all newly generated viewports are popped after plotting.- return_grob
logical. Should a snapshot of the display be returned as a grid grob?
- ...
additional graphics parameters (see
par)
Details
A points' coordinates are found by computing the gravity center of mass points using the data entries as weights. Thus, the coordinates of a point \(P(a,b,c)\), \(a + b + c = 1\), are: \(P(b + c/2, c \sqrt{3}/2)\).
References
M. Friendly (2000), Visualizing Categorical Data. SAS Institute, Cary, NC.
Examples
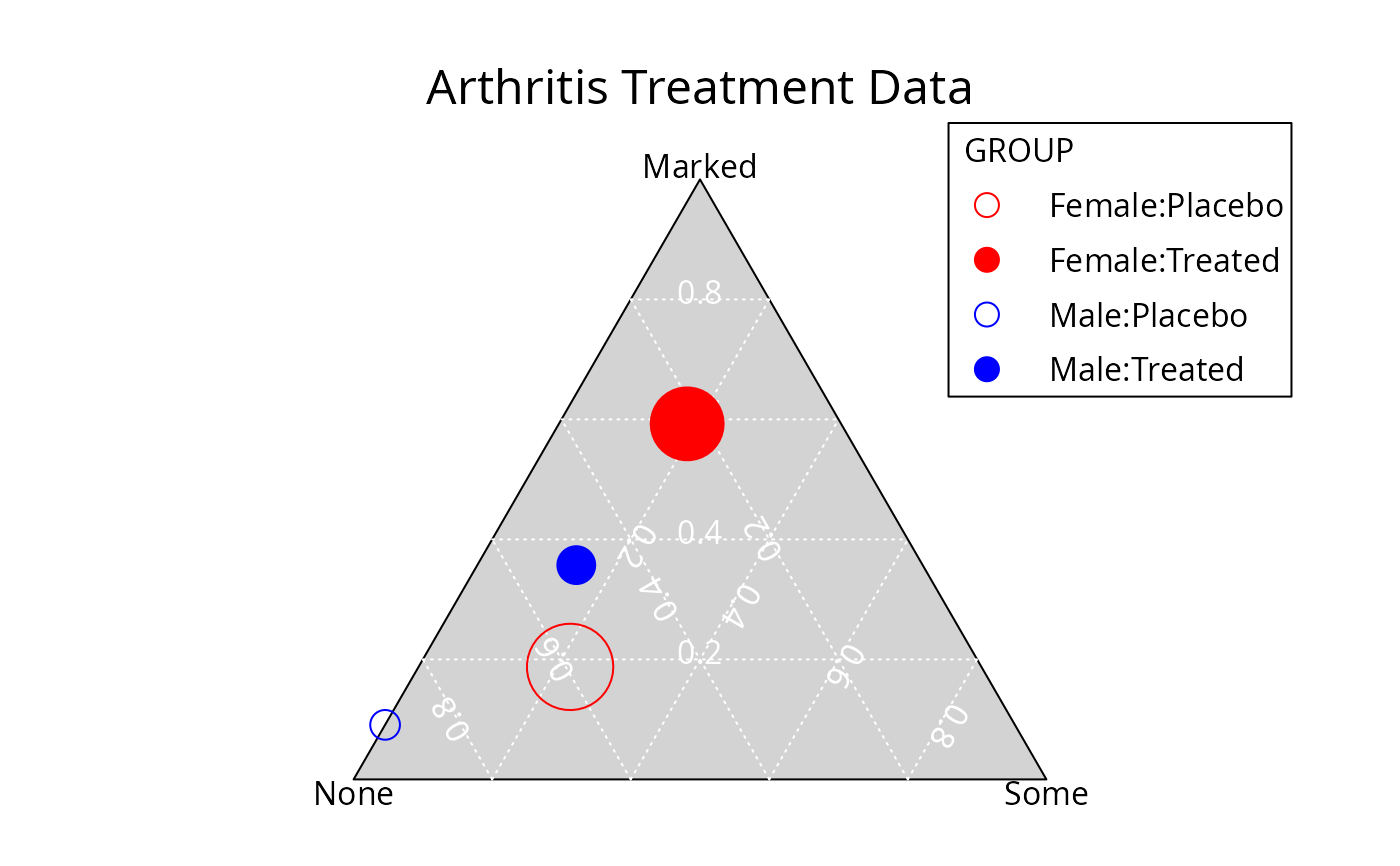
data("Arthritis")
## Build table by crossing Treatment and Sex
tab <- as.table(xtabs(~ I(Sex:Treatment) + Improved, data = Arthritis))
## Mark groups
col <- c("red", "red", "blue", "blue")
pch <- c(1, 19, 1, 19)
## plot
ternaryplot(
tab,
col = col,
pch = pch,
prop_size = TRUE,
bg = "lightgray",
grid_color = "white",
labels_color = "white",
main = "Arthritis Treatment Data"
)
## legend
grid_legend(0.8, 0.7, pch, col, rownames(tab), title = "GROUP")
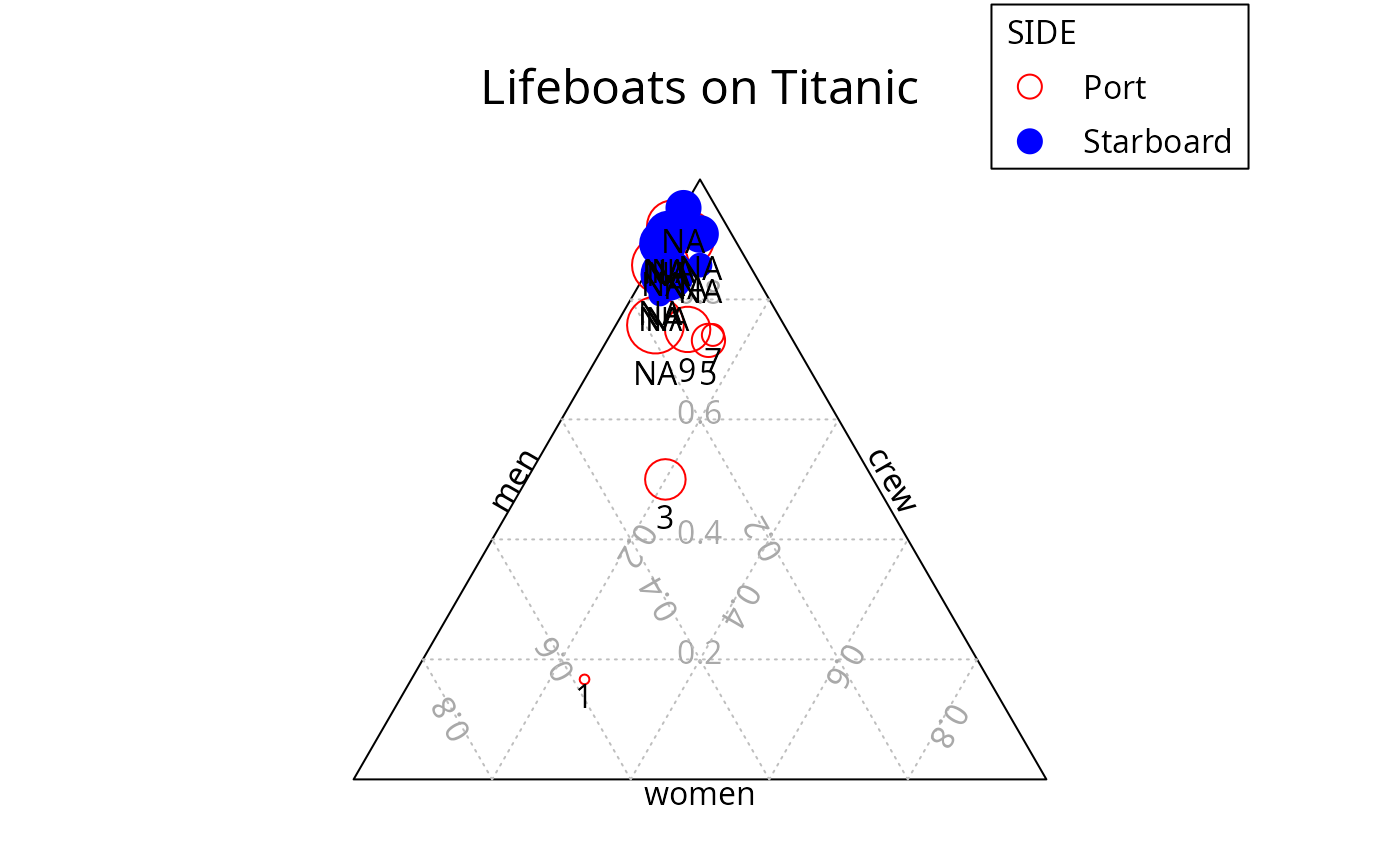
 ## Titanic
data("Lifeboats")
attach(Lifeboats)
#> The following objects are masked from Lifeboats (pos = 3):
#>
#> boat, cap, crew, launch, men, side, total, women
#> The following object is masked from package:datasets:
#>
#> women
ternaryplot(
Lifeboats[,4:6],
pch = ifelse(side == "Port", 1, 19),
col = ifelse(side == "Port", "red", "blue"),
id = ifelse(men / total > 0.1, as.character(boat), NA),
prop_size = 2,
dimnames_position = "edge",
main = "Lifeboats on Titanic"
)
grid_legend(0.8, 0.9, c(1, 19),
c("red", "blue"), c("Port", "Starboard"),
title = "SIDE")
## Titanic
data("Lifeboats")
attach(Lifeboats)
#> The following objects are masked from Lifeboats (pos = 3):
#>
#> boat, cap, crew, launch, men, side, total, women
#> The following object is masked from package:datasets:
#>
#> women
ternaryplot(
Lifeboats[,4:6],
pch = ifelse(side == "Port", 1, 19),
col = ifelse(side == "Port", "red", "blue"),
id = ifelse(men / total > 0.1, as.character(boat), NA),
prop_size = 2,
dimnames_position = "edge",
main = "Lifeboats on Titanic"
)
grid_legend(0.8, 0.9, c(1, 19),
c("red", "blue"), c("Port", "Starboard"),
title = "SIDE")
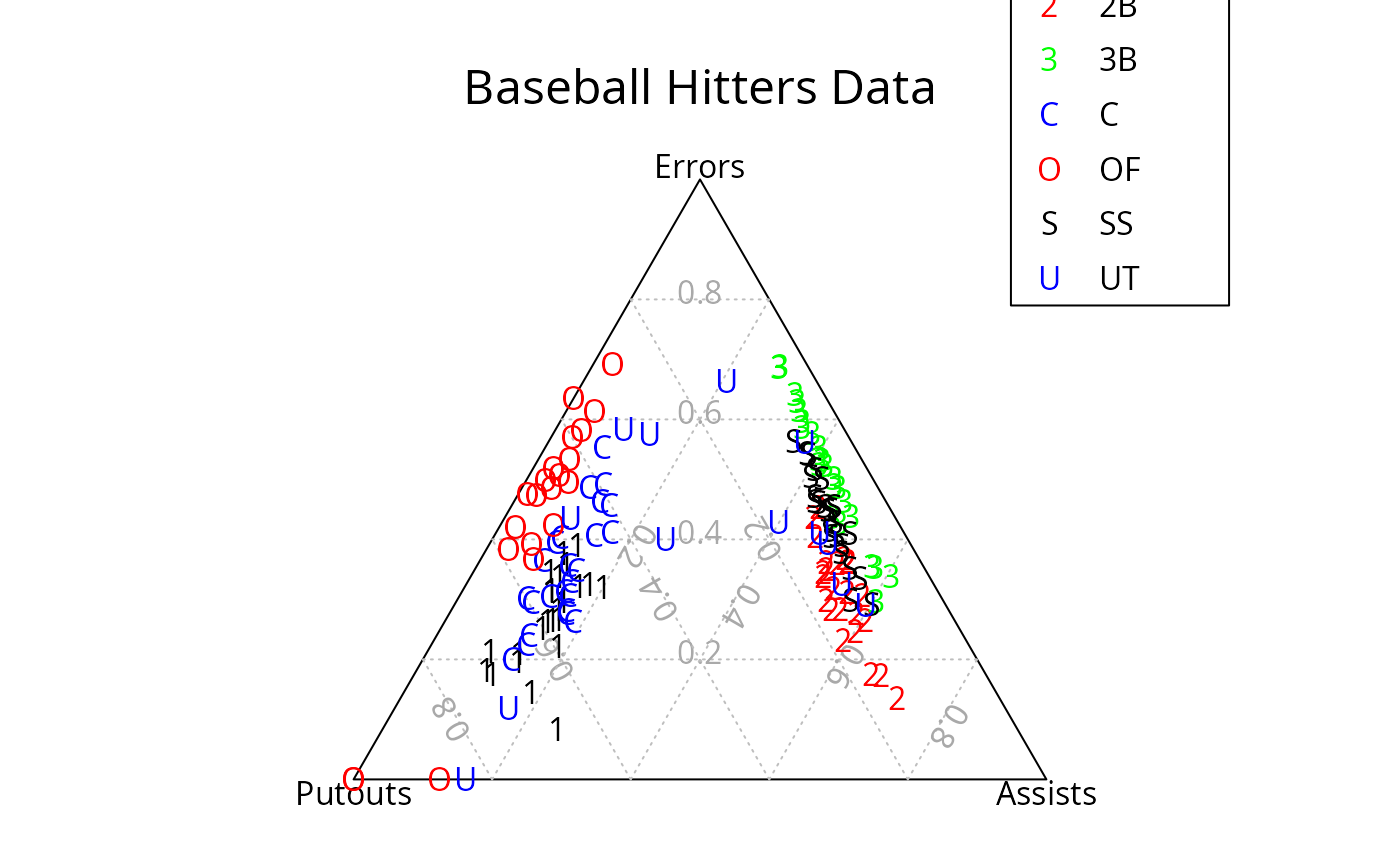
 ## Hitters
data("Hitters")
attach(Hitters)
colors <- c("black","red","green","blue","red","black","blue")
pch <- substr(levels(Positions), 1, 1)
ternaryplot(
Hitters[,2:4],
pch = as.character(Positions),
col = colors[as.numeric(Positions)],
main = "Baseball Hitters Data"
)
grid_legend(0.8, 0.9, pch, colors, levels(Positions),
title = "POSITION(S)")
## Hitters
data("Hitters")
attach(Hitters)
colors <- c("black","red","green","blue","red","black","blue")
pch <- substr(levels(Positions), 1, 1)
ternaryplot(
Hitters[,2:4],
pch = as.character(Positions),
col = colors[as.numeric(Positions)],
main = "Baseball Hitters Data"
)
grid_legend(0.8, 0.9, pch, colors, levels(Positions),
title = "POSITION(S)")