Plot Open-High-Low-Close Bar Chart
plotOHLC.RdPlots open-high-low-close bar chart of a (financial) time series.
Arguments
- x
a multivariate time series object of class
"mts".- xlim, ylim, xlab, ylab, col, bg, axes, frame.plot, ann, main
graphical arguments, see
plot,plot.defaultandpar.- date
a string indicating the type of x axis annotation. Default is calendar dates.
- format
a string indicating the format of the x axis annotation if
date == "calendar". For details seeformat.POSIXct.- origin
an R object specifying the origin of the Julian dates if
date == "calendar". Defaults to 1899-12-30 (Popular spreadsheet programs internally also use Julian dates with this origin).- ...
further graphical arguments passed to
plot.window,title,axis, andbox.
Details
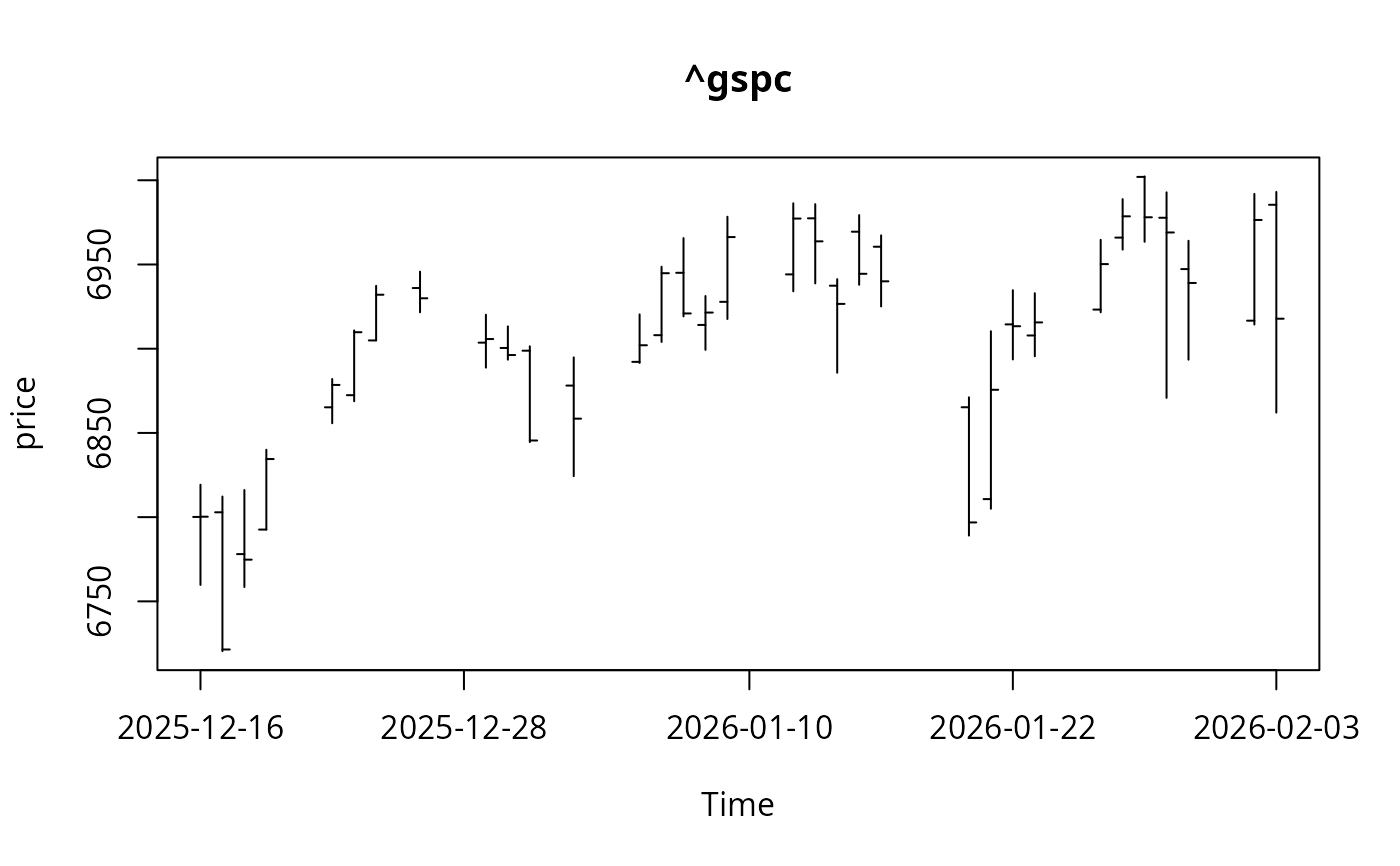
Within an open-high-low-close bar chart, each bar represents price information for the time interval between the open and the close price. The left tick for each bar indicates the open price for the time interval. The right tick indicates the closing price for the time interval. The vertical length of the bar represents the price range for the time interval.
The time scale of x must be in Julian dates (days since the
origin).
Examples
con <- url("https://finance.yahoo.com")
if(!inherits(try(open(con), silent = TRUE), "try-error")) {
  close(con)
  ## Plot OHLC bar chart for the last 'nDays' days of the instrument
  ## 'instrument'

  nDays <- 50
  instrument <- "^gspc"

  start <- strftime(as.POSIXlt(Sys.time() - nDays * 24 * 3600),
                    format="%Y-%m-%d")
  end <- strftime(as.POSIXlt(Sys.time()), format = "%Y-%m-%d")
  x <- get.hist.quote(instrument = instrument, start = start, end = end,
                      retclass = "ts")

  plotOHLC(x, ylab = "price", main = instrument)
}
#> time series ends   2026-02-03