Correlation-Adjusted t Score (CAT score)
shrinkcat.stat.Rdshrinkcat.stat and shrinkcat.fun compute a shrinkage
estimate of the “correlation-adjusted t score”
of Zuber and Strimmer (2009).
Usage
shrinkcat.stat(X, L, lambda, lambda.var, lambda.freqs, var.equal=TRUE,
   paired=FALSE, verbose=TRUE)
shrinkcat.fun(L, lambda, lambda.var, lambda.freqs, var.equal=TRUE,
   verbose=TRUE)
Arguments
- X
data matrix. Note that the columns correspond to variables (“genes”) and the rows to samples.
- L
factor with class labels for the two groups. If only a single label is given then a one-sample CAT score against 0 is computed.
- lambda
Shrinkage intensity for the correlation matrix. If not specified it is estimated from the data.
lambda=0implies no shrinkage andlambda=1complete shrinkage.- lambda.var
Shrinkage intensity for the variances. If not specified it is estimated from the data.
lambda.var=0implies no shrinkage andlambda.var=1complete shrinkage.- lambda.freqs
Shrinkage intensity for the frequencies. If not specified it is estimated from the data.
lambda.freqs=0implies no shrinkage (i.e. empirical frequencies).- var.equal
assume equal (default) or unequal variances in each group.
- paired
compute paired CAT score (default is to use unpaired CAT score).
- verbose
print out some (more or less useful) information during computation.
Details
The CAT (“correlation-adjusted t”) score is the product of the square root of the inverse correlation matrix with a vector of t scores. The CAT score thus describes the contribution of each individual feature in separating the two groups, after removing the effect of all other features.
In Zuber and Strimmer (2009)
it is shown that the CAT score is
a natural criterion to rank features in the presence of correlation.
If there is no correlation, the CAT score reduces to the usual t score
(hence in this case the estimate from shrinkcat.stat equals that from shrinkt.stat).
The function catscore implements multi-class CAT scores.
Value
shrinkcat.stat returns a vector containing a shrinkage estimate of the
“CAT score” for each variable/gene.
The corresponding shrinkcat.fun functions return a function that
computes the cat score when applied to a data matrix
(this is very useful for simulations).
The scale factor in the ”shrinkage CAT” statistic is computed from the estimated frequencies
(to use the standard empirical scale factor set lambda.freqs=0).
References
Zuber, V., and K. Strimmer. 2009. Gene ranking and biomarker discovery under correlation. Bioinformatics 25: 2700-2707. <DOI:10.1093/bioinformatics/btp460>
Author
Verena Zuber and Korbinian Strimmer (https://strimmerlab.github.io).
Examples
# load st library
library("st")
# prostate data set
data(singh2002)
X = singh2002$x
L = singh2002$y
dim(X) # 102 6033
#> [1] 102 6033
length(L) # 102
#> [1] 102
# shrinkage cat statistic
score = shrinkcat.stat(X, L)
#> Number of variables: 6033
#> Number of observations: 102
#> Number of classes: 2
#>
#> Estimating optimal shrinkage intensity lambda.freq (frequencies): 1
#> Estimating variances (pooled across classes)
#> Estimating optimal shrinkage intensity lambda.var (variance vector): 0.205
#>
#> Computing the square root of the inverse pooled correlation matrix
#> Estimating optimal shrinkage intensity lambda (correlation matrix): 0.8924
idx = order(score^2, decreasing=TRUE)
idx[1:10]
#> [1] 610 364 1720 3647 3375 332 3282 3991 1557 914
# 610 364 1720 3647 3375 332 3282 3991 1557 914
# compute q-values and local false discovery rates
library("fdrtool")
fdr.out = fdrtool(as.vector(score))
#> Step 1... determine cutoff point
#> Step 2... estimate parameters of null distribution and eta0
#> Step 3... compute p-values and estimate empirical PDF/CDF
#> Step 4... compute q-values and local fdr
#> Step 5... prepare for plotting
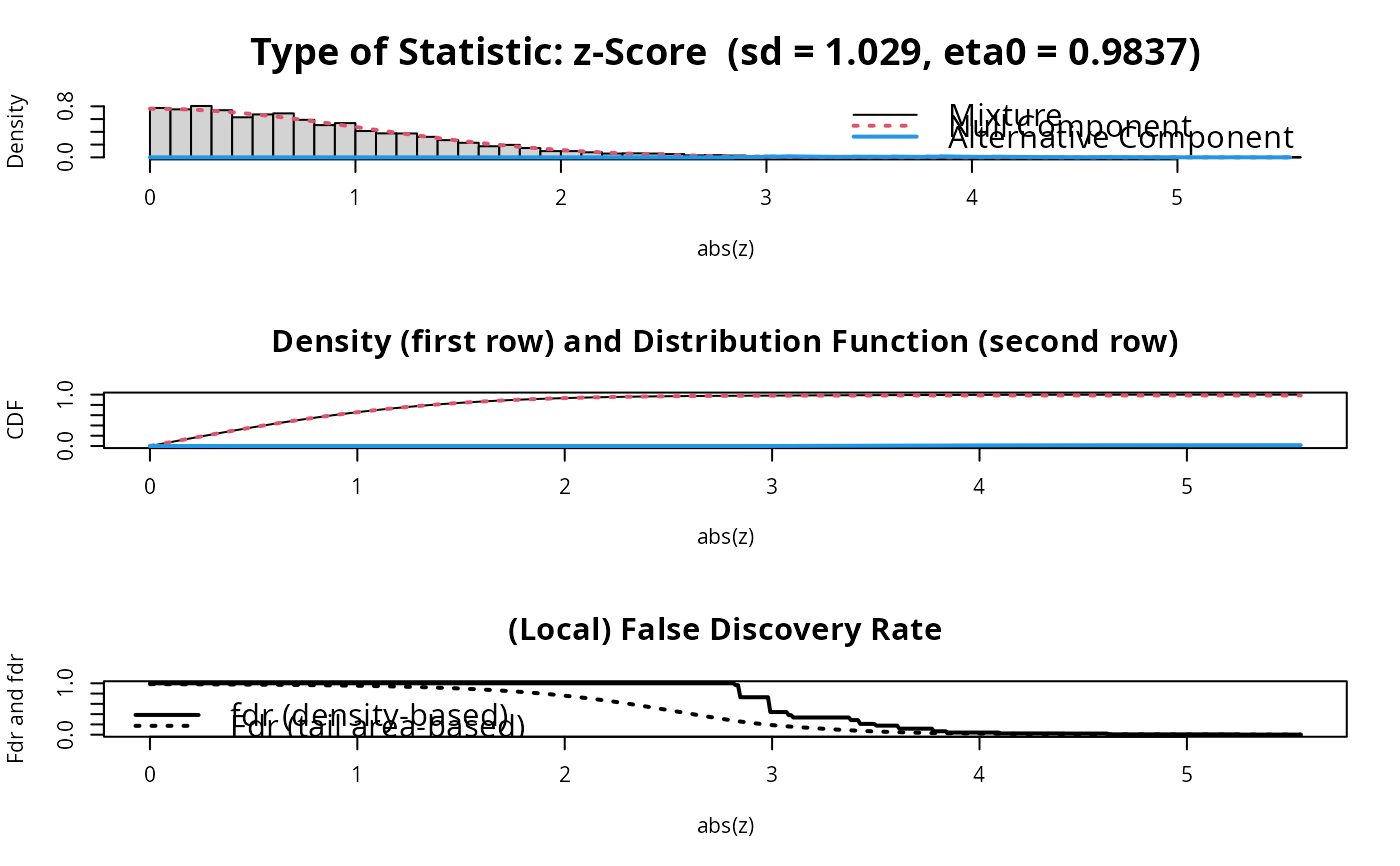 #>
sum(fdr.out$qval < 0.05)
#> [1] 56
sum(fdr.out$lfdr < 0.2)
#> [1] 62
# compared with:
# shrinkage t statistic
score = shrinkt.stat(X, L)
#> Number of variables: 6033
#> Number of observations: 102
#> Number of classes: 2
#>
#> Estimating optimal shrinkage intensity lambda.freq (frequencies): 1
#> Estimating variances (pooled across classes)
#> Estimating optimal shrinkage intensity lambda.var (variance vector): 0.205
#>
idx = order(score^2, decreasing=TRUE)
idx[1:10]
#> [1] 610 1720 3940 914 364 332 3647 4331 579 1068
# 610 1720 3940 914 364 332 3647 4331 579 1068
# shrinkage CAT score with zero correlation among predictors
# is the same as shrinkage t
score2 = shrinkcat.stat(X, L, lambda=1)
#> Number of variables: 6033
#> Number of observations: 102
#> Number of classes: 2
#>
#> Estimating optimal shrinkage intensity lambda.freq (frequencies): 1
#> Estimating variances (pooled across classes)
#> Estimating optimal shrinkage intensity lambda.var (variance vector): 0.205
#>
sum((score2-score)^2)
#> [1] 0
# Student t statistic
score = studentt.stat(X, L)
idx = order(score^2, decreasing=TRUE)
idx[1:10]
#> [1] 610 1720 364 332 914 3940 4546 1068 579 4331
# 610 1720 364 332 914 3940 4546 1068 579 4331
# shrinkage CAT score with zero correlation and no shrinkage
# is the same as student t
score2 = shrinkcat.stat(X, L, lambda=1, lambda.var=0, lambda.freqs=0,
verbose=FALSE)
sum((score2-score)^2)
#> [1] 0
# difference of means ("Fold Change")
score = diffmean.stat(X, L)
idx = order(abs(score), decreasing=TRUE)
idx[1:10]
#> [1] 735 610 694 298 698 292 739 3940 702 721
# 735 610 694 298 698 292 739 3940 702 721
## paired CAT score
# we drop two cancer cases to make samples size equal in
# the two groups to allow to compute paired statistic
X = X[1:100,]
L = L[1:100]
sum(L=="cancer") # 50
#> [1] 50
sum(L=="healthy") # 50
#> [1] 50
# paired shrinkage CAT score
scat.paired = shrinkcat.stat(X, L, paired=TRUE)
#> Number of variables: 6033
#> Number of observations: 50
#> Number of classes: 1
#>
#> Estimating optimal shrinkage intensity lambda.freq (frequencies): 1
#> Estimating variances (pooled across classes)
#> Estimating optimal shrinkage intensity lambda.var (variance vector): 0.2864
#>
#> Computing the square root of the inverse pooled correlation matrix
#> Estimating optimal shrinkage intensity lambda (correlation matrix): 0.9258
# for zero correlation the paired shrinkage CAT score
# reduces to the paired shrinkage t score
score = shrinkt.stat(X, L, paired=TRUE, verbose=FALSE)
score2 = shrinkcat.stat(X, L, lambda=1, paired=TRUE, verbose=FALSE)
sum((score-score2)^2)
#> [1] 0
#>
sum(fdr.out$qval < 0.05)
#> [1] 56
sum(fdr.out$lfdr < 0.2)
#> [1] 62
# compared with:
# shrinkage t statistic
score = shrinkt.stat(X, L)
#> Number of variables: 6033
#> Number of observations: 102
#> Number of classes: 2
#>
#> Estimating optimal shrinkage intensity lambda.freq (frequencies): 1
#> Estimating variances (pooled across classes)
#> Estimating optimal shrinkage intensity lambda.var (variance vector): 0.205
#>
idx = order(score^2, decreasing=TRUE)
idx[1:10]
#> [1] 610 1720 3940 914 364 332 3647 4331 579 1068
# 610 1720 3940 914 364 332 3647 4331 579 1068
# shrinkage CAT score with zero correlation among predictors
# is the same as shrinkage t
score2 = shrinkcat.stat(X, L, lambda=1)
#> Number of variables: 6033
#> Number of observations: 102
#> Number of classes: 2
#>
#> Estimating optimal shrinkage intensity lambda.freq (frequencies): 1
#> Estimating variances (pooled across classes)
#> Estimating optimal shrinkage intensity lambda.var (variance vector): 0.205
#>
sum((score2-score)^2)
#> [1] 0
# Student t statistic
score = studentt.stat(X, L)
idx = order(score^2, decreasing=TRUE)
idx[1:10]
#> [1] 610 1720 364 332 914 3940 4546 1068 579 4331
# 610 1720 364 332 914 3940 4546 1068 579 4331
# shrinkage CAT score with zero correlation and no shrinkage
# is the same as student t
score2 = shrinkcat.stat(X, L, lambda=1, lambda.var=0, lambda.freqs=0,
verbose=FALSE)
sum((score2-score)^2)
#> [1] 0
# difference of means ("Fold Change")
score = diffmean.stat(X, L)
idx = order(abs(score), decreasing=TRUE)
idx[1:10]
#> [1] 735 610 694 298 698 292 739 3940 702 721
# 735 610 694 298 698 292 739 3940 702 721
## paired CAT score
# we drop two cancer cases to make samples size equal in
# the two groups to allow to compute paired statistic
X = X[1:100,]
L = L[1:100]
sum(L=="cancer") # 50
#> [1] 50
sum(L=="healthy") # 50
#> [1] 50
# paired shrinkage CAT score
scat.paired = shrinkcat.stat(X, L, paired=TRUE)
#> Number of variables: 6033
#> Number of observations: 50
#> Number of classes: 1
#>
#> Estimating optimal shrinkage intensity lambda.freq (frequencies): 1
#> Estimating variances (pooled across classes)
#> Estimating optimal shrinkage intensity lambda.var (variance vector): 0.2864
#>
#> Computing the square root of the inverse pooled correlation matrix
#> Estimating optimal shrinkage intensity lambda (correlation matrix): 0.9258
# for zero correlation the paired shrinkage CAT score
# reduces to the paired shrinkage t score
score = shrinkt.stat(X, L, paired=TRUE, verbose=FALSE)
score2 = shrinkcat.stat(X, L, lambda=1, paired=TRUE, verbose=FALSE)
sum((score-score2)^2)
#> [1] 0