adds part of a cylinder to a plot
cylindersegment.Rdadds a segment of a cylinder to a plot
cylindersegment(rx = 1, ry = rx, from = pi, to = 3*pi/2, len = 1,
                mid = c(0,0), angle = 0, dr = 0.01, col = "black",
                delt = 1.0, ...)
Arguments
- rx
horizontal radius of full cylinder.
- ry
vertical radius of full cylinder.
- from
start radius of segment, radians.
- to
end radius of segment, radians.
- len
cylinder length.
- mid
midpoint of cylinder.
- angle
rotation angle, degrees.
- dr
size of segments, in radians, to draw top/bottom ellipse (decrease for smoother).
- col
color of slice.
- delt
increase factor, from left to right.
- ...
arguments passed to polygon function.
Details
When angle = 0 (the default), the cylindersegment is parallel
to the x-axis.
rx and ry are the horizontal and vertical radiusses of
the bordering ellipses.
Here "horizontal" and "vertical" denote the position BEFORE rotation
if delt > 1, the width of the cylinder will increase from
left to right.
See also
Examples
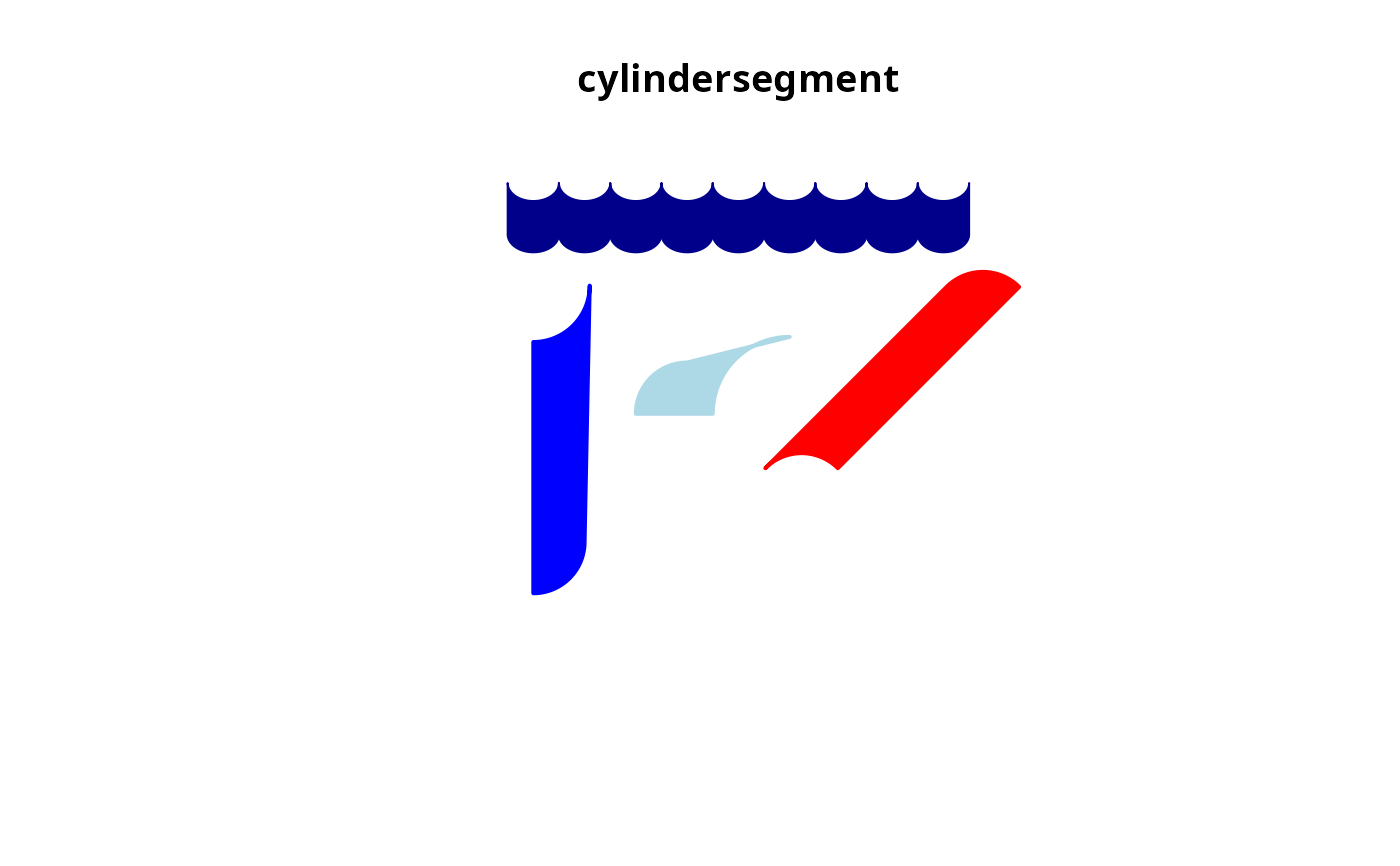
emptyplot(main = "cylindersegment")
cylindersegment(mid = c(0.1, 0.5), rx = 0.1, ry = 0.1,
                from = pi, to = 3*pi/2, col = "blue",
                len = 0.5, delt = 1.1, lwd = 2, angle = 90)
cylindersegment(mid = c(0.8, 0.5), rx = 0.1, ry = 0.1,
                from = 0, to = pi/2, col = "red", len = 0.5,
                delt = 1.0, lwd = 2, angle = 45)
cylindersegment(mid = c(0.5, 0.5), rx = 0.1, ry = 0.1,
                from = pi/2, to = pi, col = "lightblue",
                len = 0.2, delt = 1.5, lwd = 2)
for (i in seq(0.1, 0.9, 0.1))
  cylindersegment(mid = c(i, 0.9), rx = 0.035, ry = 0.05,
                  from = pi/2, to = 3*pi/2, col = "darkblue",
                  len = 0.1, angle = 90)