Generates a data frame for regression analysis
genCorrelatedData.RdThe output is a data frame (x1, x2, y) with user-specified
correlation between x1 and x2. The y (output) variable is created
according to the equation
$$
y = beta1 + beta2 * x1 + beta3 * x2 + beta4 * x1 * x2 + e.
$$
The arguments determine the scales of the X matrix, the random
error, and the slope coefficients.
Arguments
- N
Number of cases desired
- means
2-vector of means for x1 and x2
- sds
2-vector of standard deviations for x1 and x2
- rho
Correlation coefficient for x1 and x2
- stde
standard deviation of the error term in the data generating equation
- beta
beta vector of at most 4 coefficients for intercept, slopes, and interaction
Details
The vector (x1,x2) is drawn from a multivariate normal
distribution in which the expected value (argument means).
The covariance matrix of X is
built from the standard deviations (sds)
and the specified correlation between x1 and x2 (rho).
It is also necessary to specify the standard deviation
of the error term (stde) and the coefficients
of the regression equation (beta).
Examples
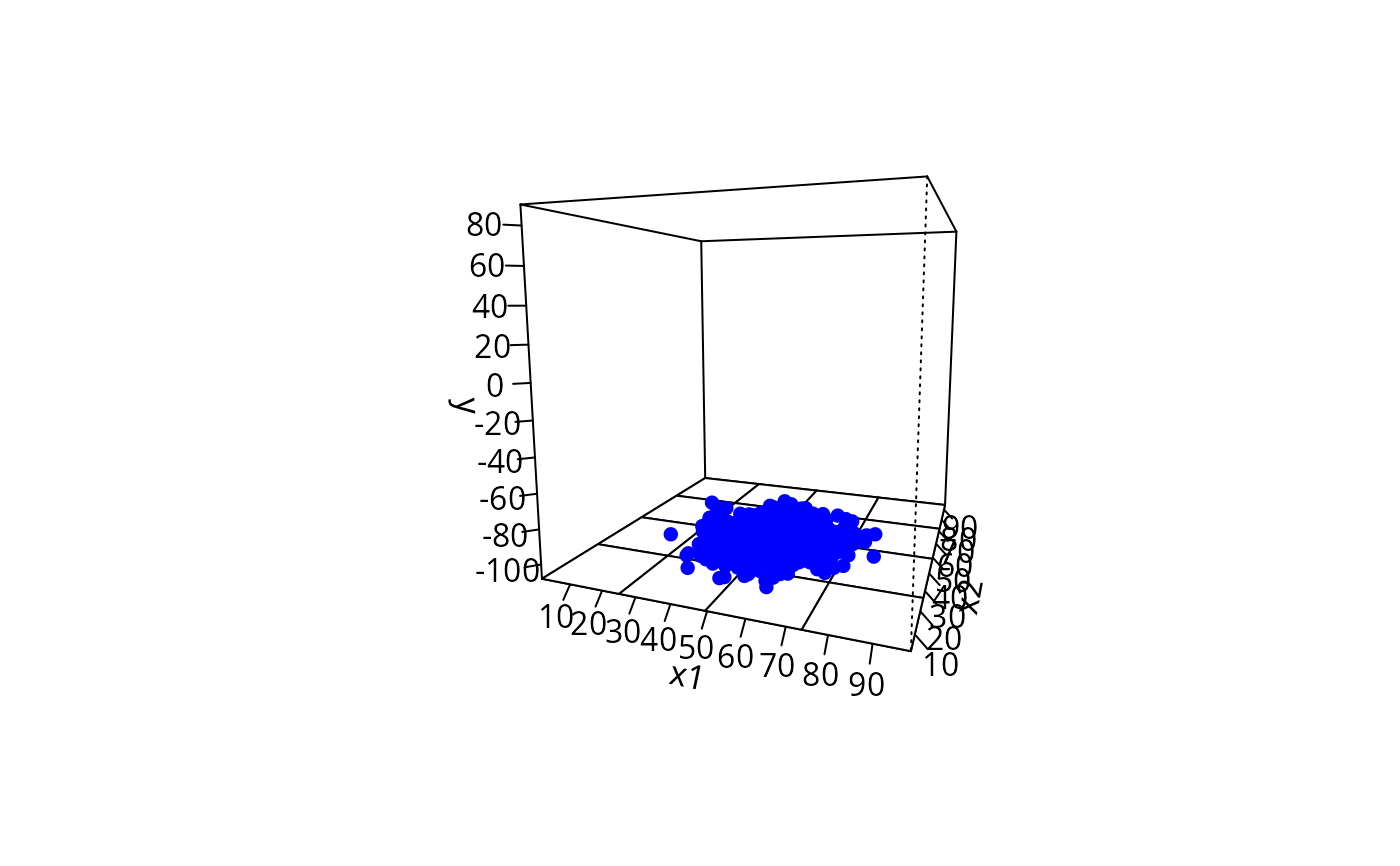
## 1000 observations of uncorrelated x1 and x2 with no
## interaction between x1 and x2
dat <- genCorrelatedData(N=1000, rho=0, beta=c(1, 1.0, -1.1, 0.0))
mcGraph1(dat$x1, dat$x2, dat$y, theta=20, phi=8,
ticktype="detailed", nticks=10)
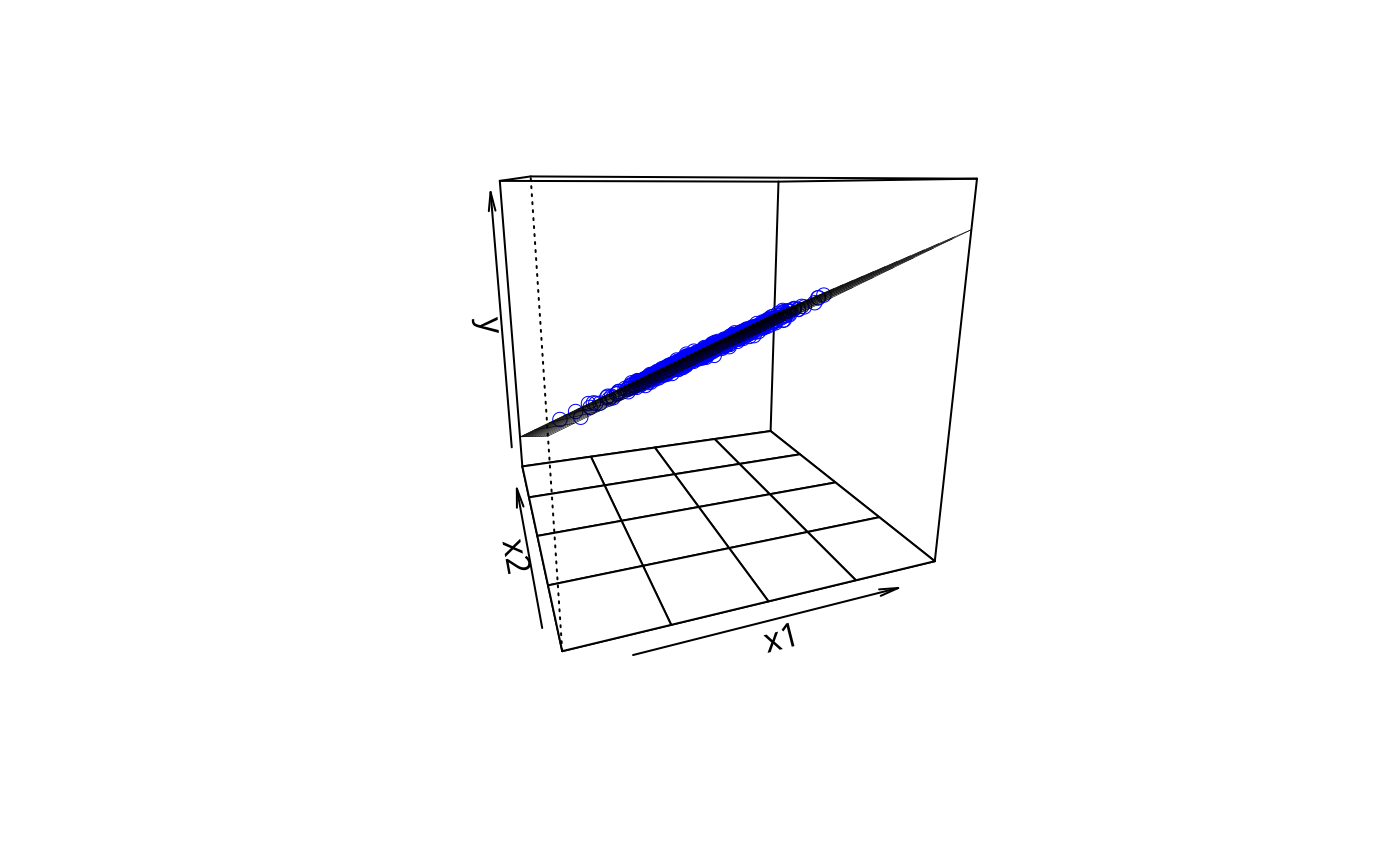
 m1 <- lm(y ~ x1 + x2, data = dat)
plotPlane(m1, plotx1 = "x1", plotx2 = "x2")
m1 <- lm(y ~ x1 + x2, data = dat)
plotPlane(m1, plotx1 = "x1", plotx2 = "x2")