Points Method for Polynomials
points.polynomial.RdAdd a polynomial to an existing plot usually as a point plot.
# S3 method for class 'polynomial'
points(x, length = 100, ...)
Arguments
Details
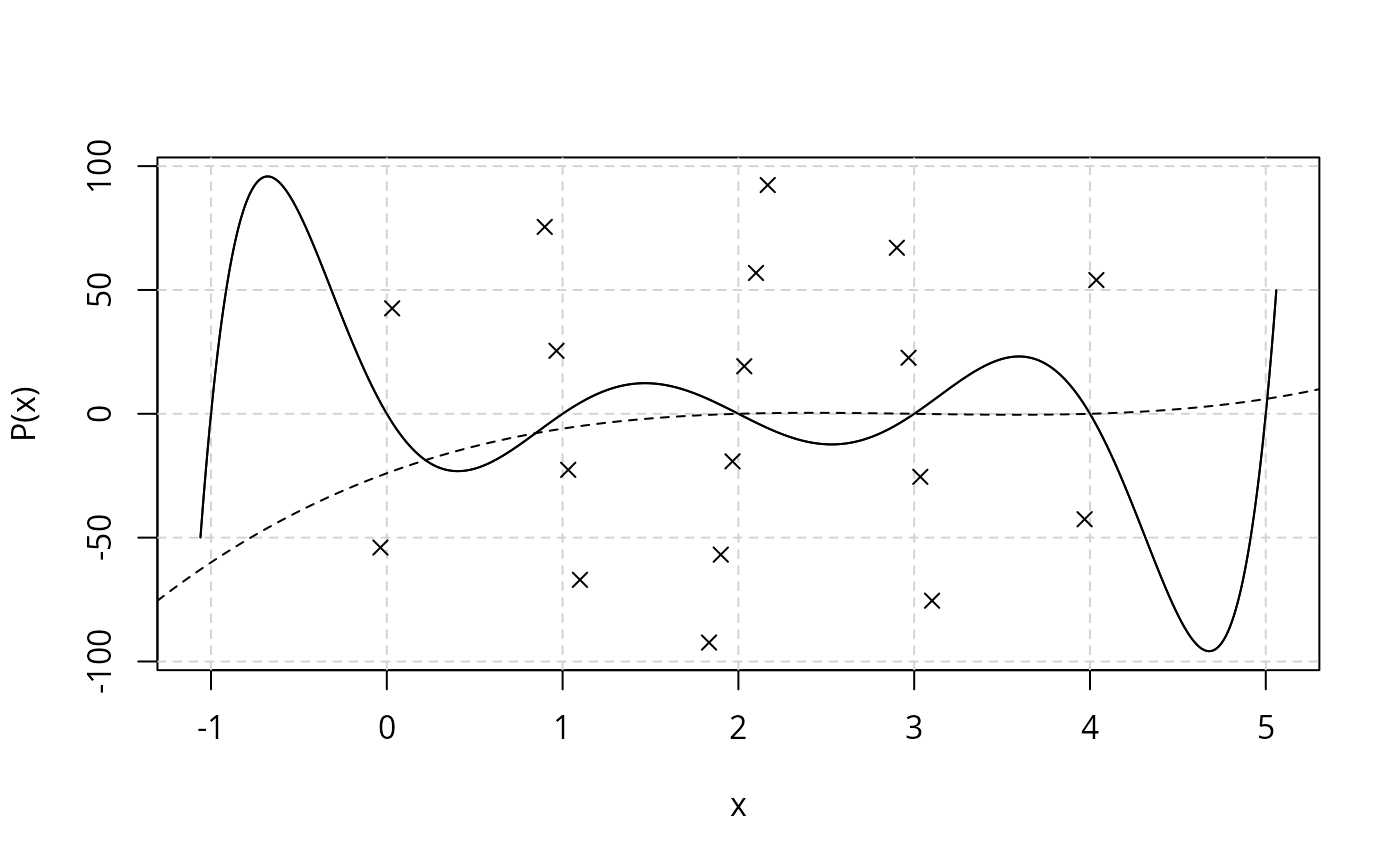
This is a method for the generic function points.
Points representing the given polynomial are added to an existing plot. Values outside the current plot region are not shown.