Lines Method for Polynomials
lines.polynomial.RdAdd a polynomial to an existing plot usually as a line plot.
# S3 method for class 'polynomial'
lines(x, len = 1000, xlim = NULL, ylim = NULL, ...)
Arguments
- x
an object of class
"polynomial".- len
size of vector at which evaluations are to be made.
- xlim, ylim
the range of x and y values with sensible defaults.
- ...
additional arguments as for the
linesgeneric.
Details
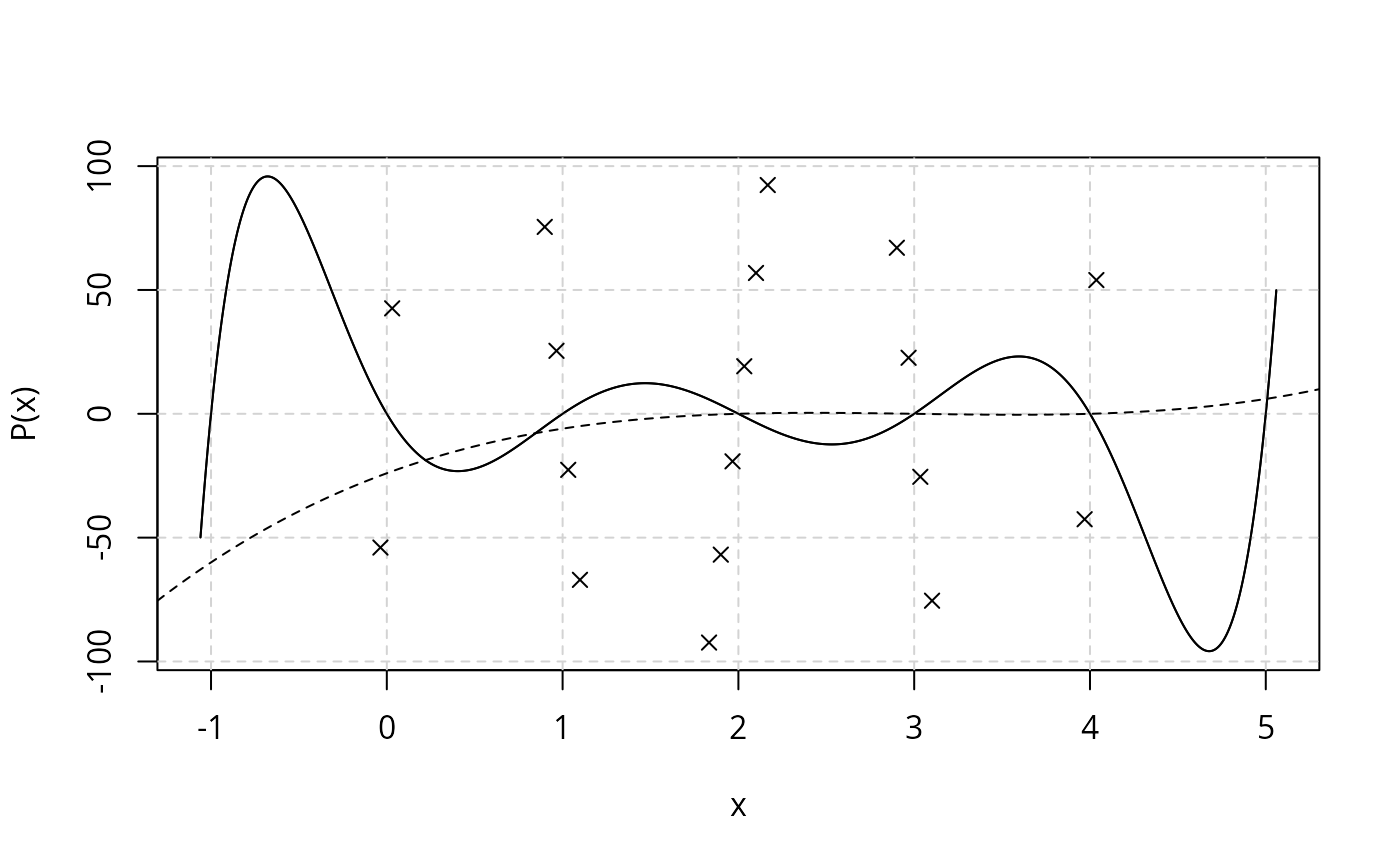
This is a method for the generic function lines.
Lines representing the given polynomial are added to an existing plot. Values outside the current plot region are not shown.