For each subset of a data frame, apply function then combine results into a
list. dlply is similar to by except that the results
are returned in a different format.
To apply a function for each row, use alply with
.margins set to 1.
dlply(
  .data,
  .variables,
  .fun = NULL,
  ...,
  .progress = "none",
  .inform = FALSE,
  .drop = TRUE,
  .parallel = FALSE,
  .paropts = NULL
)
Arguments
- .data
data frame to be processed
- .variables
variables to split data frame by, as
as.quotedvariables, a formula or character vector- .fun
function to apply to each piece
- ...
other arguments passed on to
.fun- .progress
name of the progress bar to use, see
create_progress_bar- .inform
produce informative error messages? This is turned off by default because it substantially slows processing speed, but is very useful for debugging
- .drop
should combinations of variables that do not appear in the input data be preserved (FALSE) or dropped (TRUE, default)
- .parallel
if
TRUE, apply function in parallel, using parallel backend provided by foreach- .paropts
a list of additional options passed into the
foreachfunction when parallel computation is enabled. This is important if (for example) your code relies on external data or packages: use the.exportand.packagesarguments to supply them so that all cluster nodes have the correct environment set up for computing.
Value
list of results
Input
This function splits data frames by variables.
Output
If there are no results, then this function will return
a list of length 0 (list()).
References
Hadley Wickham (2011). The Split-Apply-Combine Strategy for Data Analysis. Journal of Statistical Software, 40(1), 1-29. https://www.jstatsoft.org/v40/i01/.
See also
Examples
linmod <- function(df) {
lm(rbi ~ year, data = mutate(df, year = year - min(year)))
}
models <- dlply(baseball, .(id), linmod)
models[[1]]
#>
#> Call:
#> lm(formula = rbi ~ year, data = mutate(df, year = year - min(year)))
#>
#> Coefficients:
#> (Intercept) year
#> 118.924 -1.732
#>
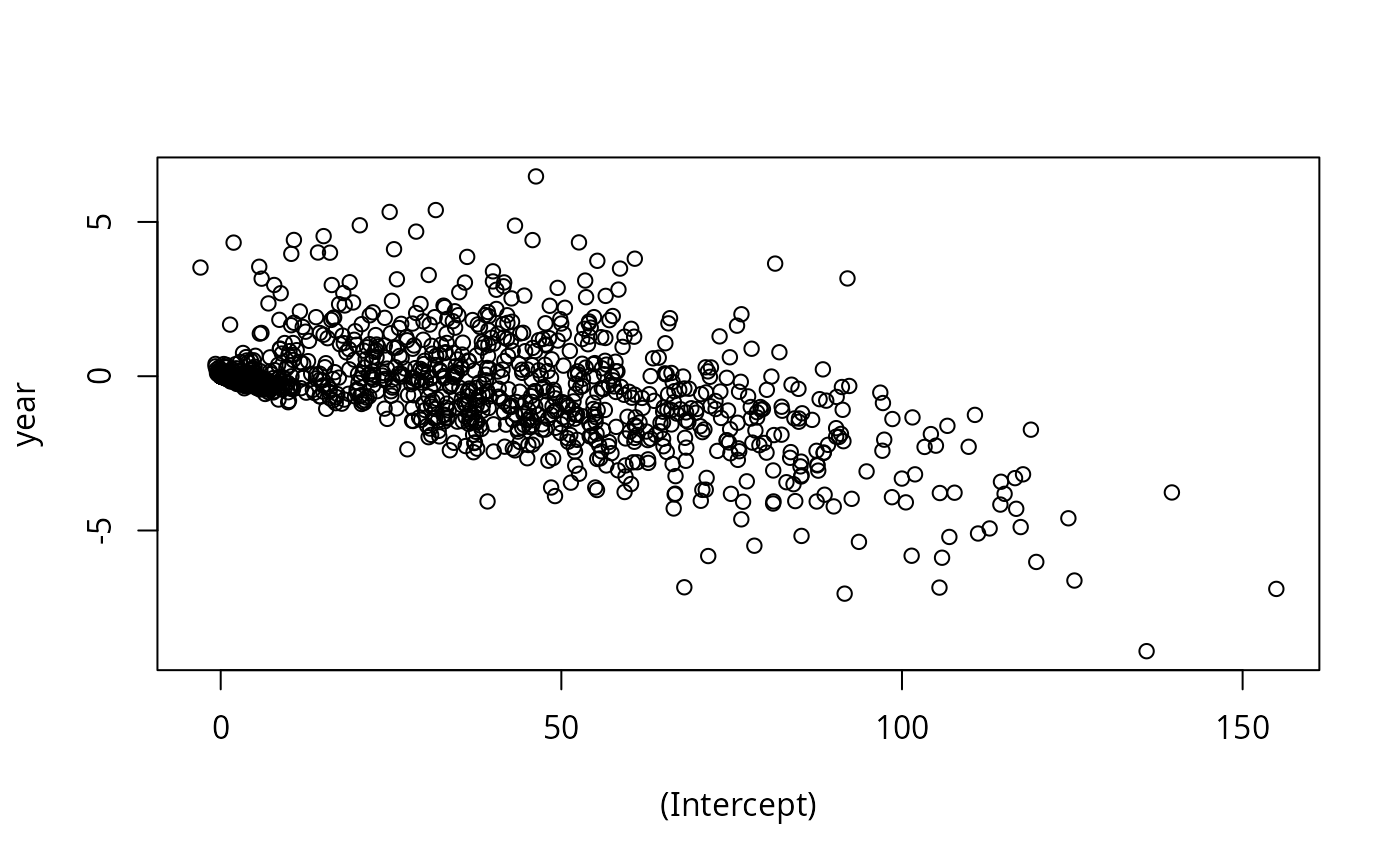
coef <- ldply(models, coef)
with(coef, plot(`(Intercept)`, year))
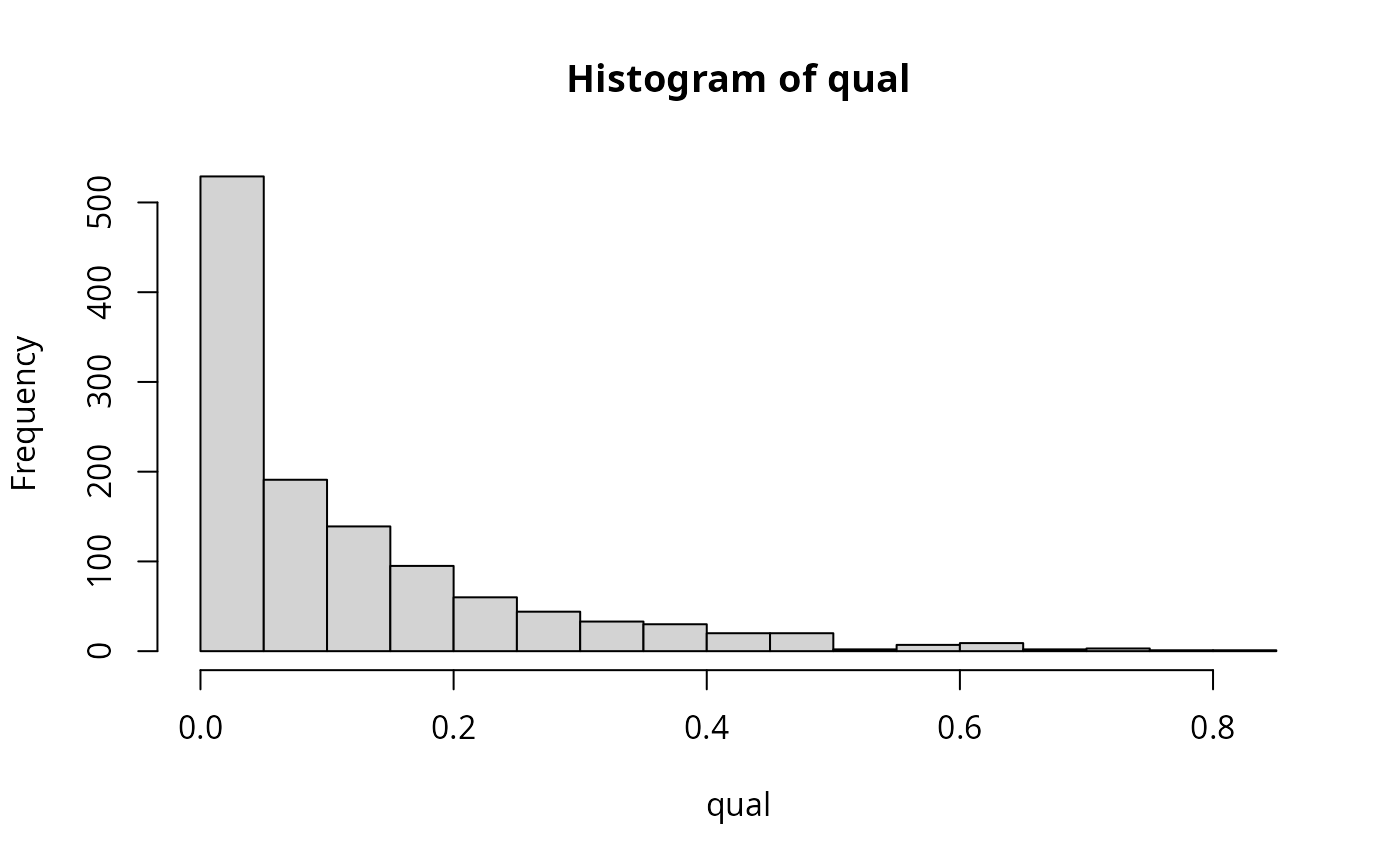
 qual <- laply(models, function(mod) summary(mod)$r.squared)
hist(qual)
qual <- laply(models, function(mod) summary(mod)$r.squared)
hist(qual)