Add Loops to a Plot
network.loop.Rdnetwork.loop draws a "loop" at a specified location; this is used to
designate self-ties in plot.network.
Usage
network.loop(
  x0,
  y0,
  length = 0.1,
  angle = 10,
  width = 0.01,
  col = 1,
  border = 1,
  lty = 1,
  offset = 0,
  edge.steps = 10,
  radius = 1,
  arrowhead = TRUE,
  xctr = 0,
  yctr = 0,
  ...
)
Arguments
- x0
a vector of x coordinates for points of origin.
- y0
a vector of y coordinates for points of origin.
- length
arrowhead length, in current plotting units.
- angle
arrowhead angle (in degrees).
- width
width for loop body, in current plotting units (can be a vector).
- col
loop body color (can be a vector).
- border
loop border color (can be a vector).
- lty
loop border line type (can be a vector).
- offset
offset for origin point (can be a vector).
- edge.steps
number of steps to use in approximating curves.
- radius
loop radius (can be a vector).
- arrowhead
boolean; should arrowheads be used? (Can be a vector.)
- xctr
x coordinate for the central location away from which loops should be oriented.
- yctr
y coordinate for the central location away from which loops should be oriented.
- ...
additional arguments to
polygon.
Details
network.loop is the companion to network.arrow; like
the latter, plot elements produced by network.loop are drawn using
polygon, and as such are scaled based on the current plotting
device. By default, loops are drawn so as to encompass a circular region of
radius radius, whose center is offset units from x0,y0
and at maximum distance from xctr,yctr. This is useful for functions
like plot.network, which need to draw loops incident to
vertices of varying radii.
Note
network.loop is a direct adaptation of
gplot.loop, from the sna package.
Author
Carter T. Butts buttsc@uci.edu
Examples
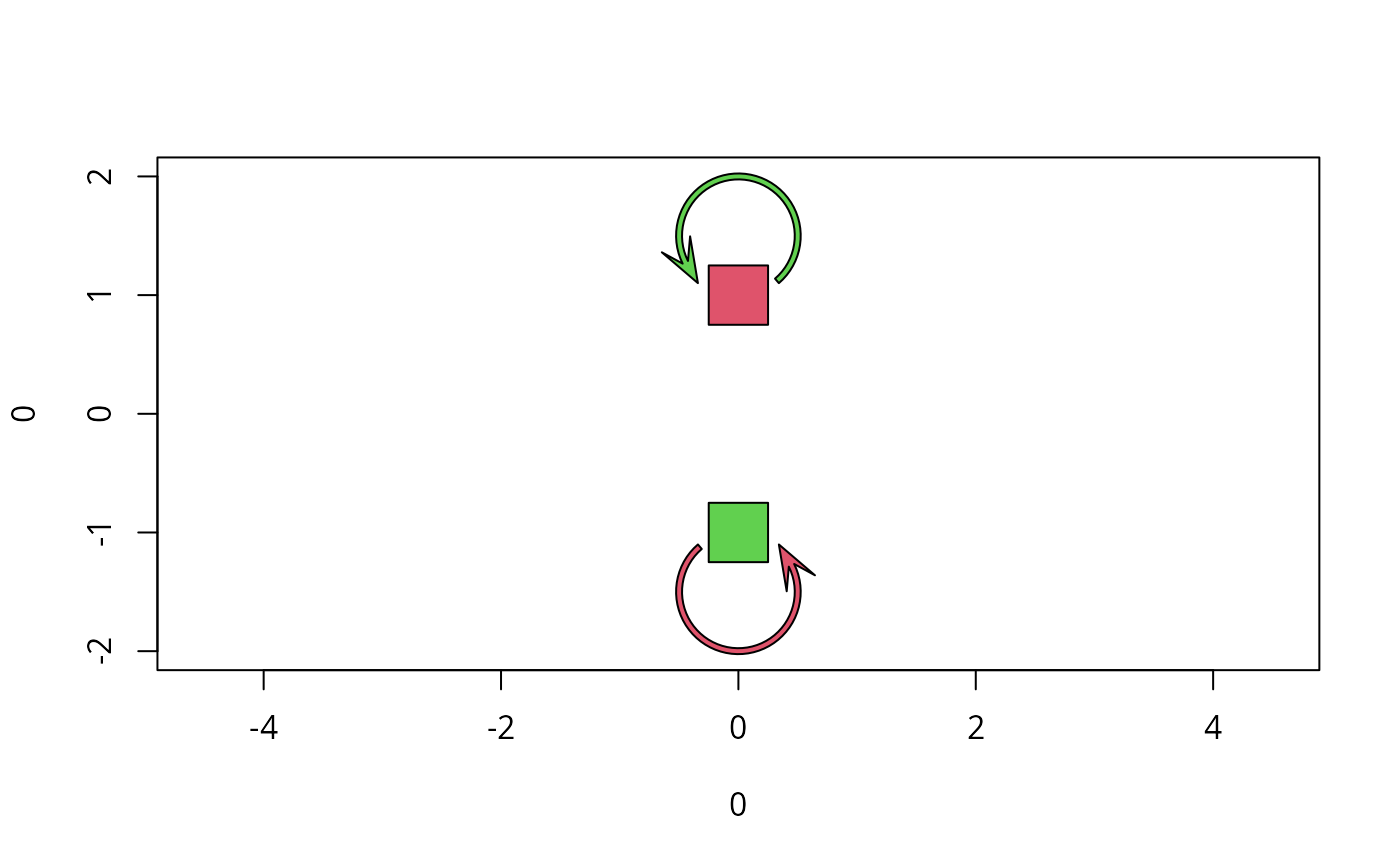
#Plot a few polygons with loops
plot(0,0,type="n",xlim=c(-2,2),ylim=c(-2,2),asp=1)
network.loop(c(0,0),c(1,-1),col=c(3,2),width=0.05,length=0.4,
  offset=sqrt(2)/4,angle=20,radius=0.5,edge.steps=50,arrowhead=TRUE)
polygon(c(0.25,-0.25,-0.25,0.25,NA,0.25,-0.25,-0.25,0.25),
    c(1.25,1.25,0.75,0.75,NA,-1.25,-1.25,-0.75,-0.75),col=c(2,3))