Add Arrows or Segments to a Plot
network.arrow.Rdnetwork.arrow draws a segment or arrow between two pairs of points;
unlike arrows or segments, the new plot element
is drawn as a polygon.
Usage
network.arrow(
  x0,
  y0,
  x1,
  y1,
  length = 0.1,
  angle = 20,
  width = 0.01,
  col = 1,
  border = 1,
  lty = 1,
  offset.head = 0,
  offset.tail = 0,
  arrowhead = TRUE,
  curve = 0,
  edge.steps = 50,
  ...
)
Arguments
- x0
A vector of x coordinates for points of origin
- y0
A vector of y coordinates for points of origin
- x1
A vector of x coordinates for destination points
- y1
A vector of y coordinates for destination points
- length
Arrowhead length, in current plotting units
- angle
Arrowhead angle (in degrees)
- width
Width for arrow body, in current plotting units (can be a vector)
- col
Arrow body color (can be a vector)
- border
Arrow border color (can be a vector)
- lty
Arrow border line type (can be a vector)
- offset.head
Offset for destination point (can be a vector)
- offset.tail
Offset for origin point (can be a vector)
- arrowhead
Boolean; should arrowheads be used? (Can be a vector))
- curve
Degree of edge curvature (if any), in current plotting units (can be a vector)
- edge.steps
For curved edges, the number of steps to use in approximating the curve (can be a vector)
- ...
Additional arguments to
polygon
Details
network.arrow provides a useful extension of segments
and arrows when fine control is needed over the resulting
display. (The results also look better.) Note that edge curvature is
quadratic, with curve providing the maximum horizontal deviation of
the edge (left-handed). Head/tail offsets are used to adjust the end/start
points of an edge, relative to the baseline coordinates; these are useful
for functions like plot.network, which need to draw edges
incident to vertices of varying radii.
Note
network.arrow is a direct adaptation of
gplot.arrow from the sna package.
References
Butts, C. T. (2008). “network: a Package for Managing Relational Data in R.” Journal of Statistical Software, 24(2). doi:10.18637/jss.v024.i02
Author
Carter T. Butts buttsc@uci.edu
Examples
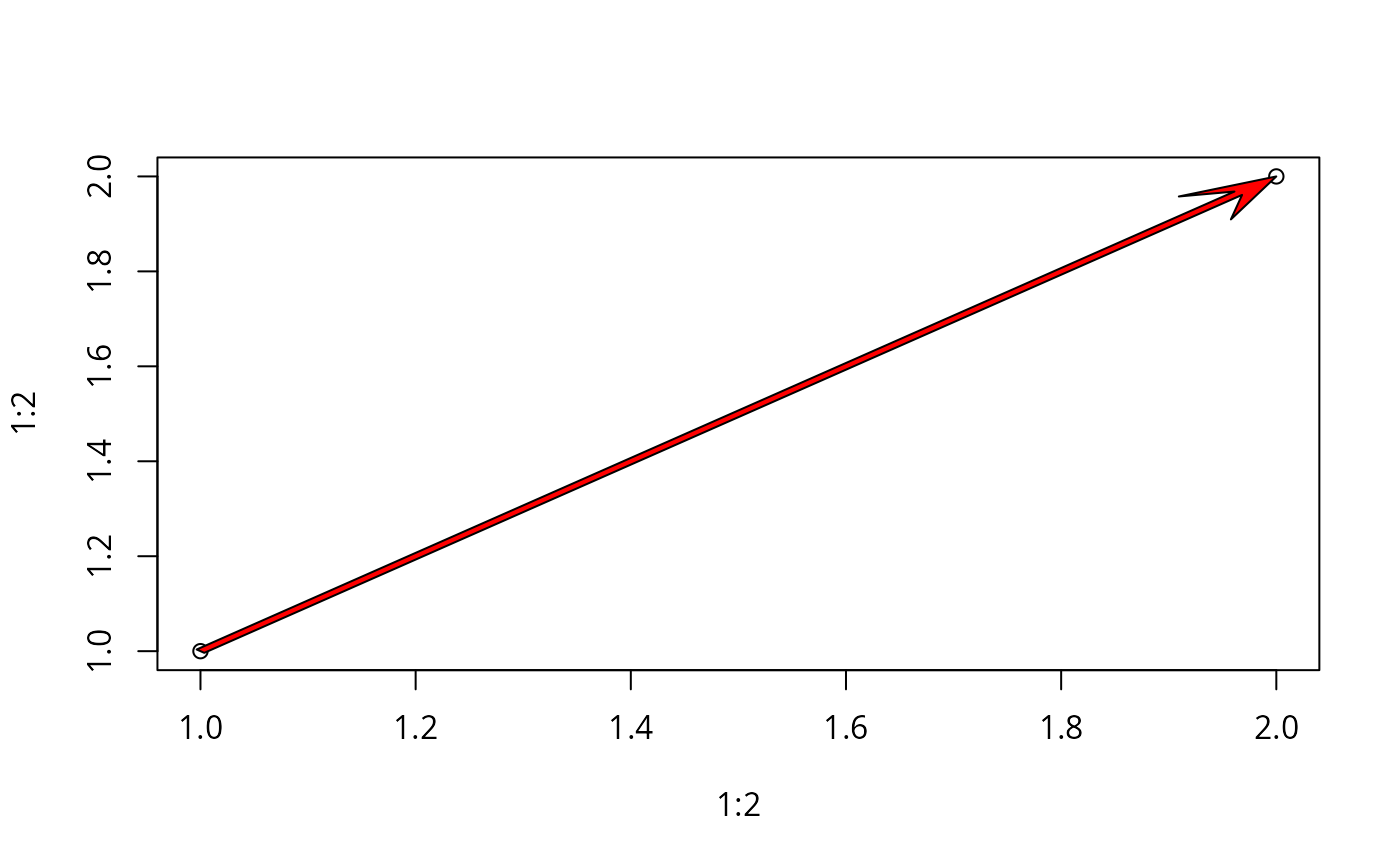
  #Plot two points
  plot(1:2,1:2)

  #Add an edge
  network.arrow(1,1,2,2,width=0.01,col="red",border="black")