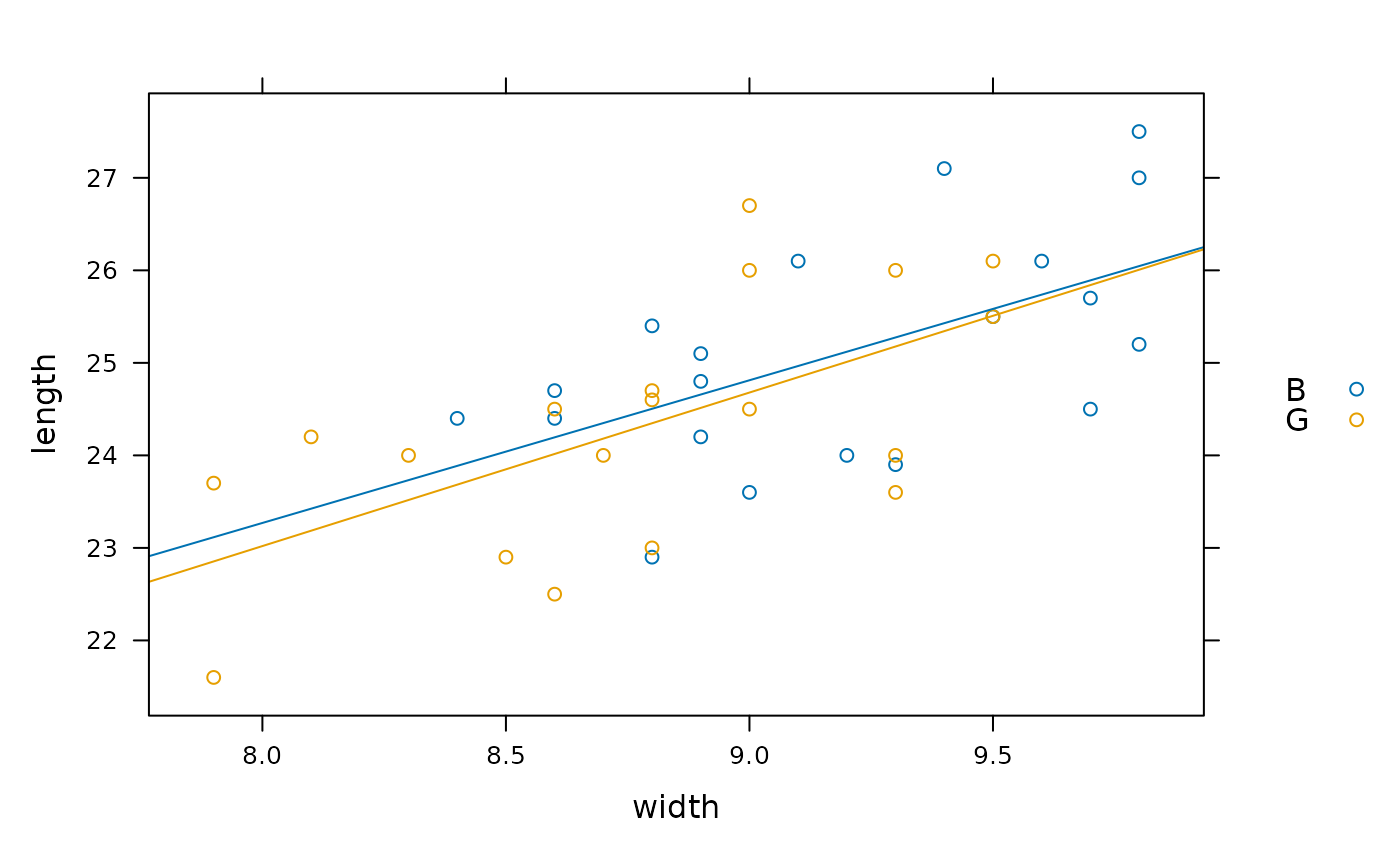
Make or add a scatter plot in a manner coordinated with plotFun.
Usage
plotPoints(
  x,
  data = parent.frame(),
  add = NULL,
  under = FALSE,
  panelfun = panel.xyplot,
  plotfun = xyplot,
  ...,
  plot = trellis.last.object()
)
Arguments
- x
A formula specifying y ~ x or z ~ x&y
- data
Data frame containing the variables to be plotted. If not specified, the variables will be looked up in the local environment
- add
If
TRUE, add points as a new layer to an existing plot. IfNULL, the value ofunderwill be used.- under
If
TRUE, the new layer will be underneath existing layers.- panelfun
Lattice panel function to be used for adding. Set only if you want something other than a scatter plot. Mainly, this is intended to add new functionality through other functions.
- plotfun
Lattice function to be used for initial plot creation. Set only if you want something other than a scatter plot. Mainly, this is intended to add new functionality through other functions.
- ...
additional arguments
- plot
a trellis plot, by default the most recently created one. If
addisTRUE, new points will be added as a new layer toplot.
Examples
if (require(mosaicData)) {
plotPoints( width ~ length, data=KidsFeet, groups=sex, pch=20)
f <- makeFun( lm( width ~ length * sex, data=KidsFeet))
plotFun( f(length=length,sex="G")~length, add=TRUE, col="pink")
plotFun( f(length=length,sex="B")~length, add=TRUE)
}
#> converting numerical color value into a color using lattice settings
#> converting numerical color value into a color using lattice settings