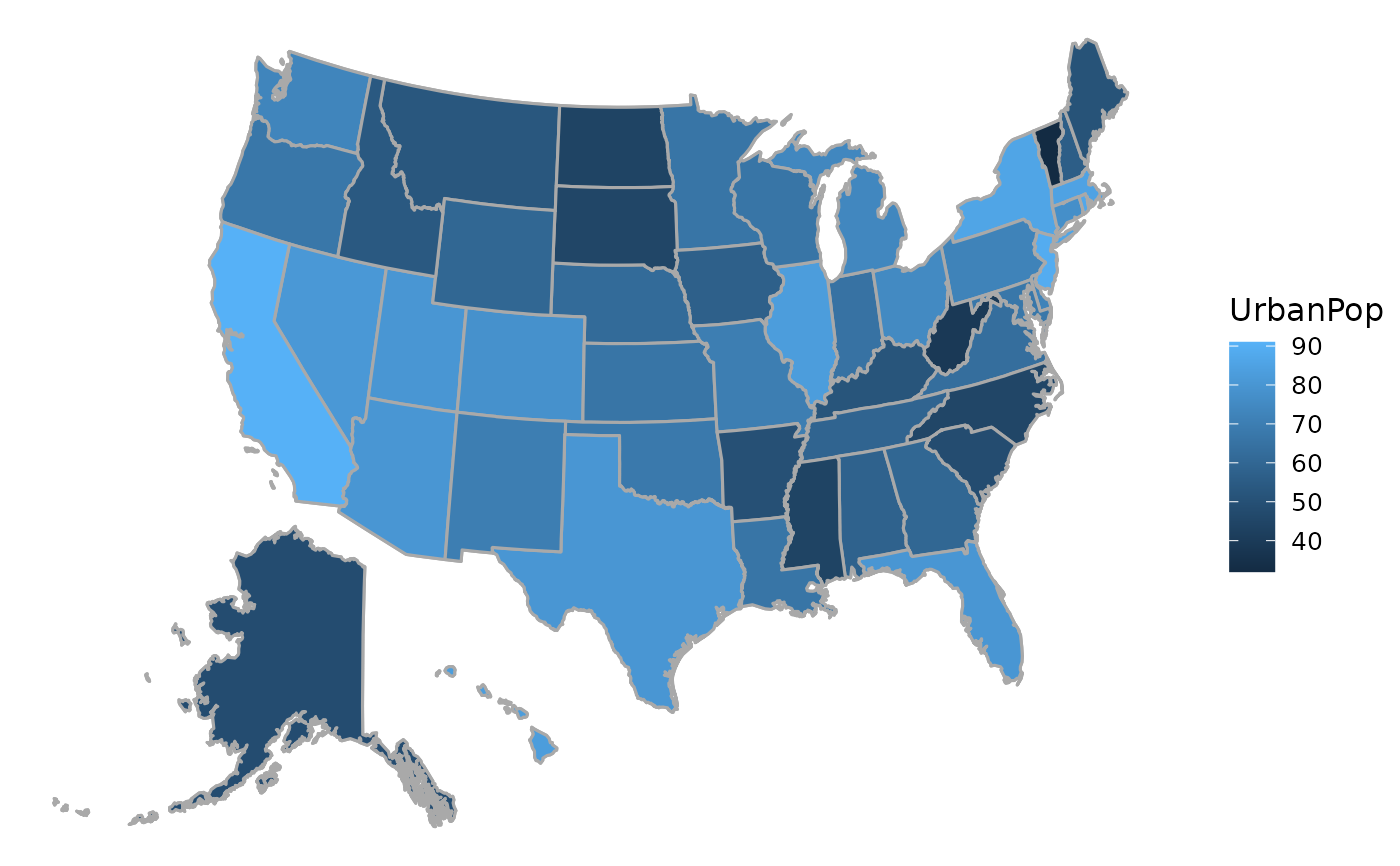
mUSMap takes in one dataframe that includes information
about different US states. It merges this dataframe with a dataframe
that includes geographical coordinate information. Depending on the
arguments passed, it returns this data or a ggplot object constructed
with the data.
Arguments
- data
A dataframe with US states as cases
- key
The column name in the
datathat holds the unique names of each state- fill
A variable in the
dataused to specify the fill color of states in the map (note: iffillis not null, thenplotcannot be set to "none")- plot
The plot desired for the output.
plot= "none" returns the merged data that is the result of merging thedataand the dataframe with the geographical coordinate information;plot= "frame" returns an empty (unplottable) ggplot object;plot= "border" (the default) returns a ggplot object with one geom_polygon layer that shows the borders of the states- style
The style in which to display the map.
compactgives a polyconic projection with Alaska and Hawaii on the lower left corner;realgives the real size and position of all states without any projection.
Examples
USArrests2 <- USArrests |> tibble::rownames_to_column("state")
mUSMap(USArrests2, key="state", fill = "UrbanPop")
#> Mapping API still under development and may change in future releases.