Autoplot method for microbenchmark objects: Prettier graphs for microbenchmark using ggplot2
Source:R/autoplot.R
autoplot.microbenchmark.RdUses ggplot2 to produce a more legible graph of microbenchmark timings.
autoplot.microbenchmark(
  object,
  ...,
  order = NULL,
  log = TRUE,
  unit = NULL,
  y_max = NULL
)
Arguments
- object
A microbenchmark object.
- ...
Ignored.
- order
Names of output column(s) to order the results.
- log
If
TRUEthe time axis will be on log scale.- unit
The unit to use for graph labels.
- y_max
The upper limit of the y axis, in the unit automatically chosen for the time axis (defaults to the maximum value).
Value
A ggplot2 object.
Examples
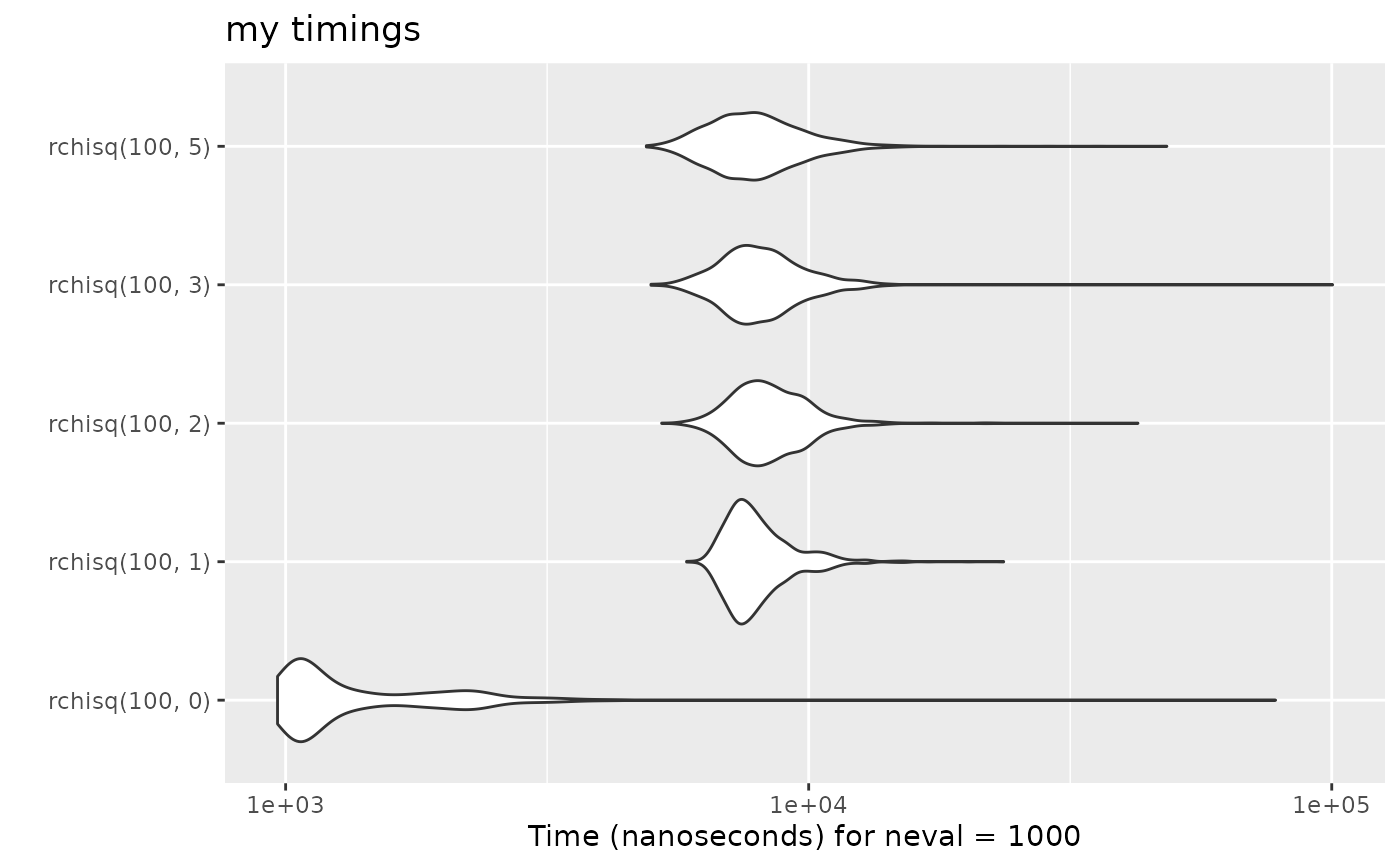
if (requireNamespace("ggplot2", quietly = TRUE)) {
    tm <- microbenchmark(rchisq(100, 0),
                         rchisq(100, 1),
                         rchisq(100, 2),
                         rchisq(100, 3),
                         rchisq(100, 5), times=1000L)
    ggplot2::autoplot(tm)

    # add a custom title
    ggplot2::autoplot(tm) + ggplot2::ggtitle("my timings")
}
#> Warning: `aes_string()` was deprecated in ggplot2 3.0.0.
#> ℹ Please use tidy evaluation idioms with `aes()`.
#> ℹ See also `vignette("ggplot2-in-packages")` for more information.
#> ℹ The deprecated feature was likely used in the microbenchmark package.
#>   Please report the issue at
#>   <https://github.com/joshuaulrich/microbenchmark/issues/>.