Default Panel Function for qqmath
panel.qqmath.RdThis is the default panel function for qqmath.
Usage
panel.qqmath(x, f.value = NULL,
             distribution = qnorm,
             qtype = 7,
             groups = NULL, ...,
             tails.n = 0,
             identifier = "qqmath")
Arguments
- x
vector (typically numeric, coerced if not) of data values to be used in the panel.
- f.value, distribution
Defines how quantiles are calculated. See
qqmathfor details.- qtype
The
typeargument to be used inquantile- groups
An optional grouping variable. Within each panel, one Q-Q plot is produced for every level of this grouping variable, differentiated by different graphical parameters.
- ...
Further arguments, often graphical parameters, eventually passed on to
panel.xyplot. Argumentsgridandablineofpanel.xyplotmay be particularly useful.- tails.n
number of data points to represent exactly on each tail of the distribution. This reproduces the effect of
f.value = NULLfor the extreme data values, while approximating the remaining data. It has no effect iff.value = NULL. Iftails.nis given,qtypeis forced to be 1.- identifier
A character string that is prepended to the names of grobs that are created by this panel function.
Details
Creates a Q-Q plot of the data and the theoretical distribution given
by distribution. Note that most of the arguments controlling
the display can be supplied directly to the high-level qqmath
call.
Author
Deepayan Sarkar Deepayan.Sarkar@R-project.org
Examples
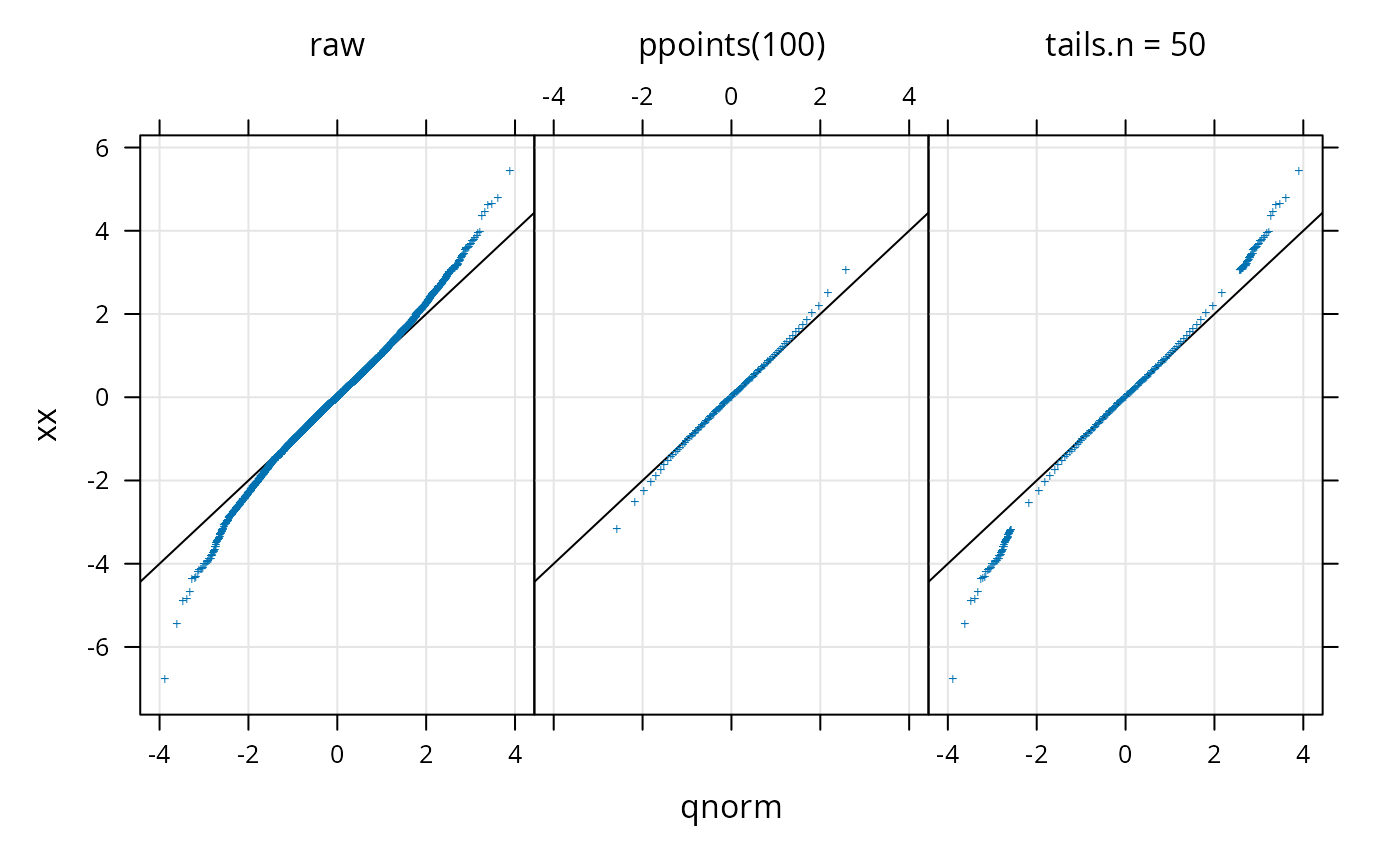
set.seed(0)
xx <- rt(10000, df = 10)
qqmath(~ xx, pch = "+", distribution = qnorm,
       grid = TRUE, abline = c(0, 1),
       xlab.top = c("raw", "ppoints(100)", "tails.n = 50"),
       panel = function(..., f.value) {
           switch(panel.number(),
                  panel.qqmath(..., f.value = NULL),
                  panel.qqmath(..., f.value = ppoints(100)),
                  panel.qqmath(..., f.value = ppoints(100), tails.n = 50))
       }, layout = c(3, 1))[c(1,1,1)]