Default Panel Function for bwplot
panel.bwplot.RdThis is the default panel function for bwplot.
Usage
panel.bwplot(x, y, box.ratio = 1,
             box.width = box.ratio / (1 + box.ratio),
             horizontal = TRUE,
             pch, col, alpha, cex,
             font, fontfamily, fontface,
             fill, varwidth = FALSE,
             notch = FALSE, notch.frac = 0.5,
             ...,
             levels.fos,
             stats = boxplot.stats,
             coef = 1.5,
             do.out = TRUE,
             identifier = "bwplot")
Arguments
- x, y
numeric vector or factor. Boxplots drawn for each unique value of
y(x) ifhorizontalisTRUE(FALSE)- box.ratio
ratio of box thickness to inter box space
- box.width
thickness of box in absolute units; overrides
box.ratio. Useful for specifying thickness when the categorical variable is not a factor, as use ofbox.ratioalone cannot achieve a thickness greater than 1.- horizontal
logical. If FALSE, the plot is ‘transposed’ in the sense that the behaviours of x and y are switched. x is now the ‘factor’. Interpretation of other arguments change accordingly. See documentation of
bwplotfor a fuller explanation.- pch, col, alpha, cex, font, fontfamily, fontface
graphical parameters controlling the dot.
pch="|"is treated specially, by replacing the dot with a line (similar toboxplot)- fill
color to fill the boxplot
- varwidth
logical. If TRUE, widths of boxplots are proportional to the number of points used in creating it.
- notch
if
notchisTRUE, a notch is drawn in each side of the boxes. If the notches of two plots do not overlap this is ‘strong evidence’ that the two medians differ (Chambers et al., 1983, p. 62). Seeboxplot.statsfor the calculations used.- notch.frac
numeric in (0,1). When
notch=TRUE, the fraction of the box width that the notches should use.- stats
a function, defaulting to
boxplot.stats, that accepts a numeric vector and returns a list similar to the return value ofboxplot.stats. The function must accept argumentscoefanddo.outeven if they do not use them (a...argument is good enough). This function is used to determine the box and whisker plot.- coef, do.out
passed to
stats- levels.fos
numeric values corresponding to positions of the factor or shingle variable. For internal use.
- ...
further arguments, ignored.
- identifier
A character string that is prepended to the names of grobs that are created by this panel function.
Details
Creates Box and Whisker plot of x for every level of
y (or the other way round if horizontal=FALSE). By
default, the actual boxplot statistics are calculated using
boxplot.stats. Note that most arguments controlling the
display can be supplied to the high-level bwplot call directly.
Although the graphical parameters for the dot representing the median
can be controlled by optional arguments, many others can not. These
parameters are obtained from the relevant settings parameters
("box.rectangle" for the box, "box.umbrella" for the
whiskers and "plot.symbol" for the outliers).
Author
Deepayan Sarkar Deepayan.Sarkar@R-project.org
Examples
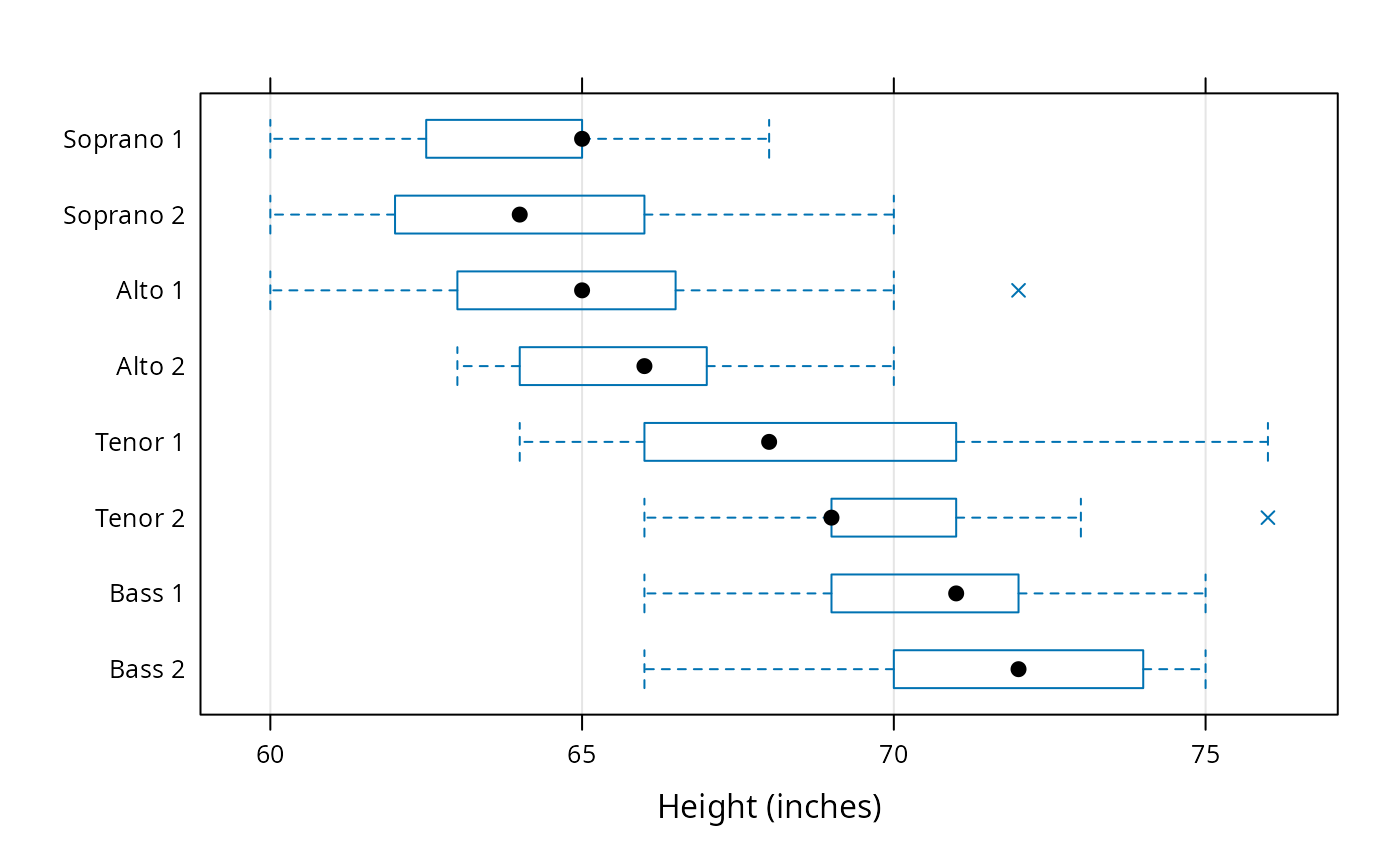
bwplot(voice.part ~ height, data = singer,
xlab = "Height (inches)",
panel = function(...) {
panel.grid(v = -1, h = 0)
panel.bwplot(...)
},
par.settings = list(plot.symbol = list(pch = 4)))
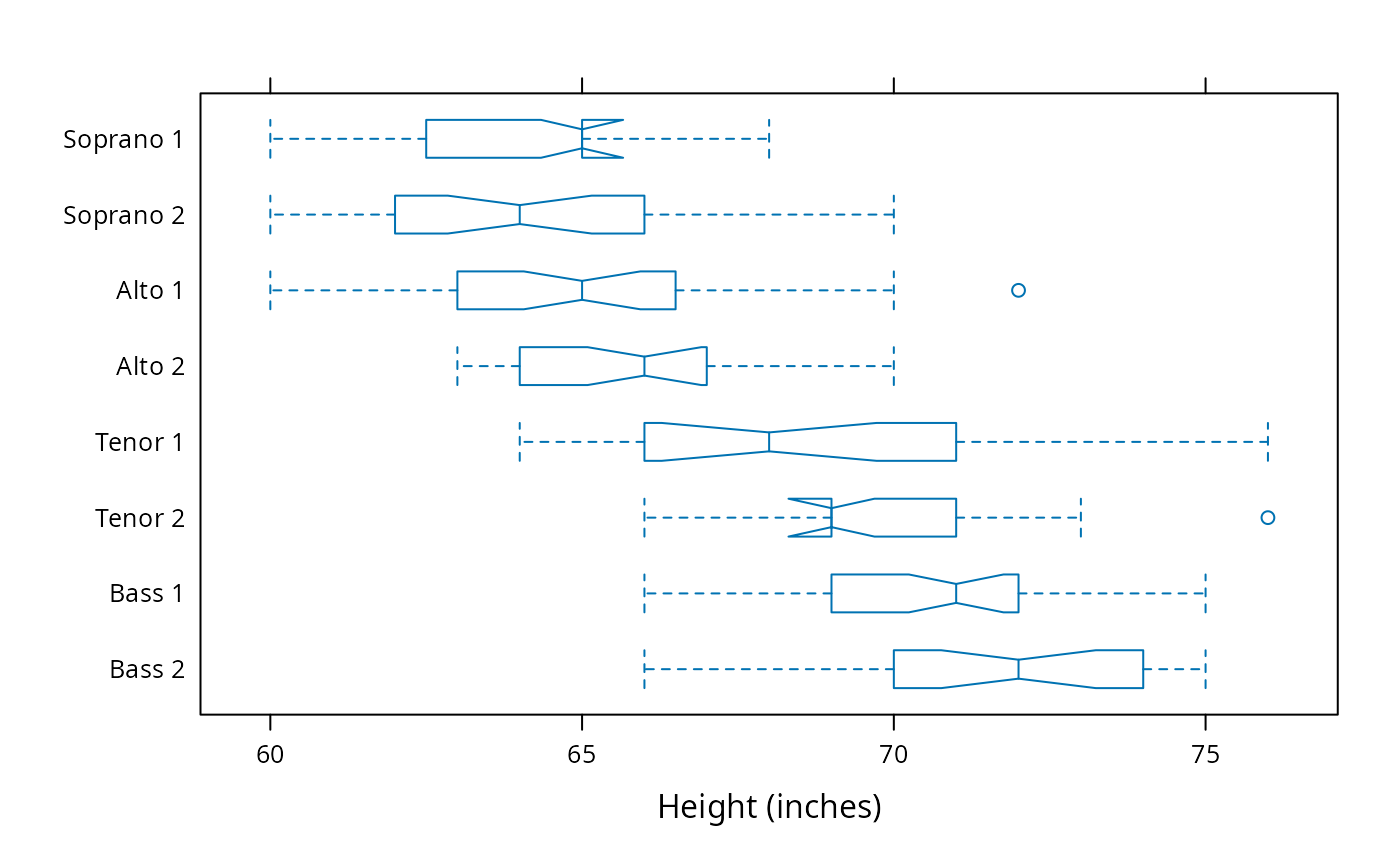
 bwplot(voice.part ~ height, data = singer,
xlab = "Height (inches)",
notch = TRUE, pch = "|")
bwplot(voice.part ~ height, data = singer,
xlab = "Height (inches)",
notch = TRUE, pch = "|")