Melanoma skin cancer incidence
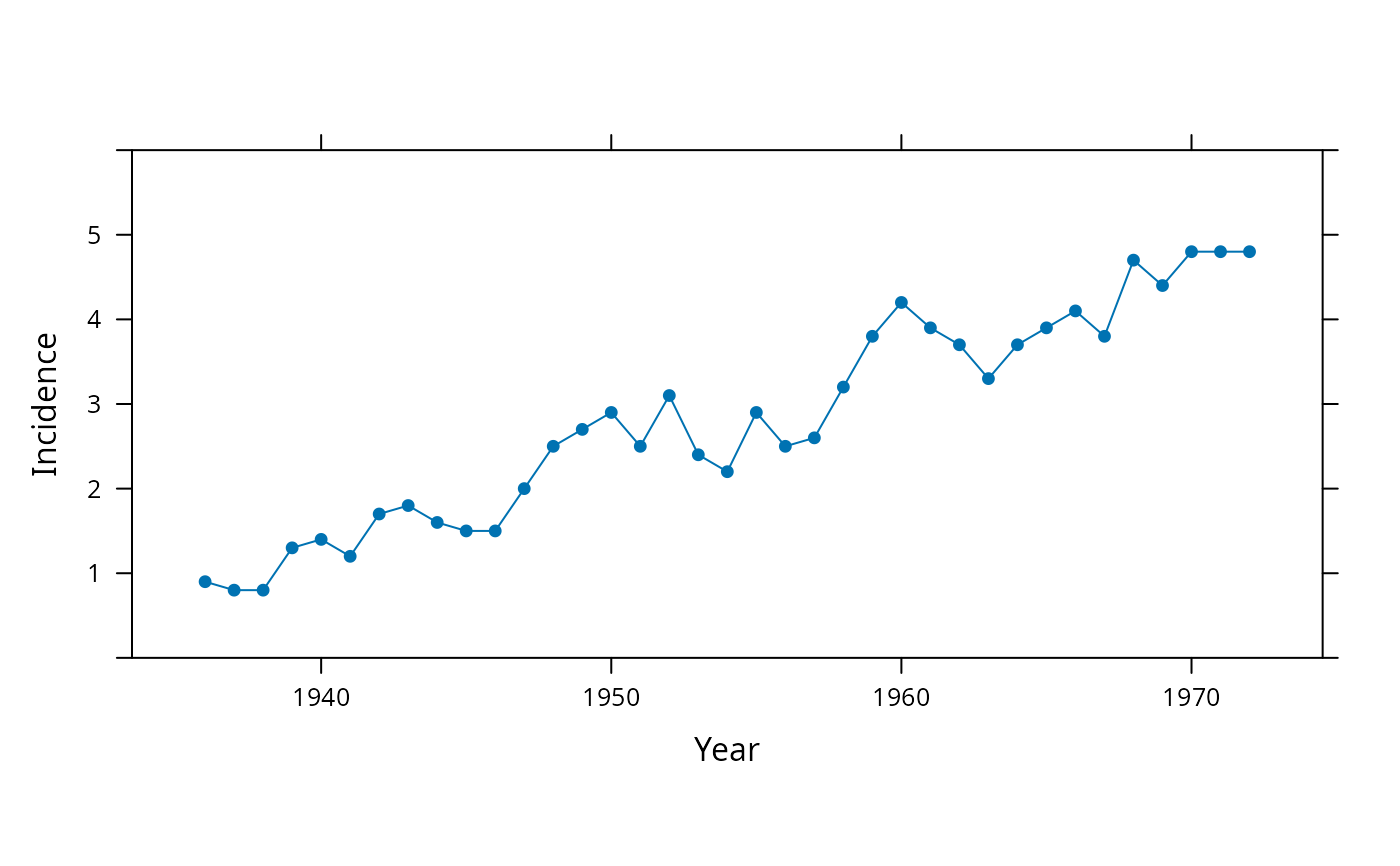
melanoma.RdThese data from the Connecticut Tumor Registry present age-adjusted numbers of melanoma skin-cancer incidences per 100,000 people in Connectict for the years from 1936 to 1972.
Format
A data frame with 37 observations on the following 2 variables.
- year
Years 1936 to 1972.
- incidence
Rate of melanoma cancer per 100,000 population.
Note
This dataset is not related to the melanoma
dataset in the boot package with the same name.
The S-PLUS 6.2 help for the melanoma data says that the incidence rate is per million, but this is not consistent with data found at the National Cancer Institute (https://www.cancer.gov/).
Source
Houghton, A., E. W. Munster, and M. V. Viola. (1978). Increased Incidence of Malignant Melanoma After Peaks of Sunspot Activity. The Lancet, 8, 759–760.
Examples
# Time-series plot.  Figure 3.64 from Cleveland.
xyplot(incidence ~ year,
  data = melanoma,
  aspect = "xy",
  panel = function(x, y)
    panel.xyplot(x, y, type="o", pch = 16),
  ylim = c(0, 6),
  xlab = "Year",
  ylab = "Incidence")